TG Therapeutics, Inc. (TGTX): Price and Financial Metrics
TGTX Price/Volume Stats
Current price | $26.32 | 52-week high | $35.67 |
Prev. close | $27.42 | 52-week low | $3.48 |
Day low | $26.26 | Volume | 1,540,472 |
Day high | $27.75 | Avg. volume | 4,480,329 |
50-day MA | $24.44 | Dividend yield | N/A |
200-day MA | $13.67 | Market Cap | 3.93B |
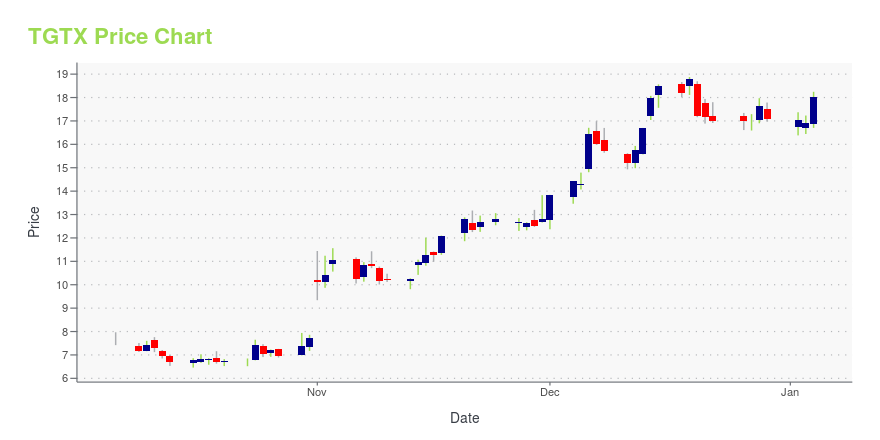
TGTX Stock Price Chart Interactive Chart >
TGTX POWR Grades
- TGTX scores best on the Growth dimension, with a Growth rank ahead of 80.19% of US stocks.
- The strongest trend for TGTX is in Value, which has been heading up over the past 179 days.
- TGTX ranks lowest in Stability; there it ranks in the 0th percentile.
TGTX Stock Summary
- TGTX's price/sales ratio is 487.53; that's higher than the P/S ratio of 99.11% of US stocks.
- With a year-over-year growth in debt of 37.41%, TG THERAPEUTICS INC's debt growth rate surpasses 79.94% of about US stocks.
- In terms of volatility of its share price, TGTX is more volatile than 94.76% of stocks we're observing.
- Stocks with similar financial metrics, market capitalization, and price volatility to TG THERAPEUTICS INC are APLS, AIP, LGVN, TDUP, and TFFP.
- Visit TGTX's SEC page to see the company's official filings. To visit the company's web site, go to www.tgtherapeutics.com.
TGTX Valuation Summary
- In comparison to the median Healthcare stock, TGTX's price/sales ratio is 22686.36% higher, now standing at 501.3.
- TGTX's price/sales ratio has moved NA NA over the prior 159 months.
Below are key valuation metrics over time for TGTX.
Stock | Date | P/S | P/B | P/E | EV/EBIT |
---|---|---|---|---|---|
TGTX | 2023-05-23 | 501.3 | 156.6 | -25.5 | -27.4 |
TGTX | 2023-05-22 | 498.2 | 155.6 | -25.3 | -27.3 |
TGTX | 2023-05-19 | 522.0 | 163.1 | -26.5 | -28.6 |
TGTX | 2023-05-18 | 534.1 | 166.9 | -27.2 | -29.2 |
TGTX | 2023-05-17 | 551.3 | 172.3 | -28.0 | -30.1 |
TGTX | 2023-05-16 | 529.7 | 165.5 | -26.9 | -29.0 |
TGTX Growth Metrics
- Its 5 year revenue growth rate is now at -0.25%.
- The 3 year revenue growth rate now stands at 5105.26%.
- Its 2 year price growth rate is now at -68.05%.

The table below shows TGTX's growth in key financial areas (numbers in millions of US dollars).
Date | Revenue | Operating Cash Flow | Net Income to Common Stock |
---|---|---|---|
2022-09-30 | 5.025 | -239.209 | -238.679 |
2022-06-30 | 6.961 | -271.915 | -288.498 |
2022-03-31 | 7.912 | -282.968 | -326.485 |
2021-12-31 | 6.689 | -295.634 | -348.101 |
2021-09-30 | 4.406 | -260.751 | -342.98 |
2021-06-30 | 2.414 | -250.082 | -344.506 |
TGTX's Quality Factors
The “Quality” component of the POWR Ratings focuses on 31 different factors of a companies fundamentals and operational strength. Here are some key insights as we drill into the specifics of these quality attributes.- TGTX has a Quality Grade of D, ranking ahead of 7.5% of graded US stocks.
- TGTX's asset turnover comes in at 0.005 -- ranking 411th of 681 Pharmaceutical Products stocks.
- TMBR, ATRA, and EVOK are the stocks whose asset turnover ratios are most correlated with TGTX.
The table below shows TGTX's key quality metrics over time.
Period | Asset Turnover | Gross Margin | ROIC |
---|---|---|---|
2021-06-30 | 0.005 | 0.881 | -27.668 |
2021-03-31 | 0.002 | 0.847 | -42.516 |
2020-12-31 | 0.000 | 1.000 | -36.140 |
2020-09-30 | 0.001 | 1.000 | -86.159 |
2020-06-30 | 0.001 | 1.000 | -22.399 |
2020-03-31 | 0.001 | 1.000 | -12.310 |
TGTX Price Target
For more insight on analysts targets of TGTX, see our TGTX price target page. And for a list of of all stocks sorted by upside potential based on analyst target price, see our Top Price Target page.
Average Price Target | $75.33 | Average Broker Recommendation | 1.44 (Moderate Buy) |
TG Therapeutics, Inc. (TGTX) Company Bio
TG Therapeutics is a biopharmaceutical company focused on the acquisition, development and commercialization of novel treatments for B-cell malignancies and autoimmune diseases. The company was founded in 1993 and is based in New York, New York.
Latest TGTX News From Around the Web
Below are the latest news stories about TG THERAPEUTICS INC that investors may wish to consider to help them evaluate TGTX as an investment opportunity.
When Will TG Therapeutics, Inc. (NASDAQ:TGTX) Turn A Profit?With the business potentially at an important milestone, we thought we'd take a closer look at TG Therapeutics, Inc.'s... |
TG Therapeutics, Inc. (NASDAQ:TGTX) Q1 2023 Earnings Call TranscriptTG Therapeutics, Inc. (NASDAQ:TGTX) Q1 2023 Earnings Call Transcript May 1, 2023 TG Therapeutics, Inc. beats earnings expectations. Reported EPS is $-0.28, expectations were $-0.37. Operator: Greetings, and welcome to the TG Therapeutics First Quarter 2023 Earnings Call. At this time, all participants are in a listen-only mode. A question-and-answer session will follow the formal […] |
TG Therapeutics to Participate in the Bank of America Securities 2023 Health Care ConferenceFireside chat scheduled for Tuesday, May 9, 2023, at 3:00 PM PTNEW YORK, May 04, 2023 (GLOBE NEWSWIRE) -- TG Therapeutics, Inc. (NASDAQ: TGTX) today announced that Michael S. Weiss, the Company’s Chairman and Chief Executive Officer, will participate in the Bank of America Securities 2023 Health Care Conference, being held at the Encore Hotel, in Las Vegas, NV on Tuesday May 9th through Thursday May 11th, 2023. The fireside chat is scheduled to take place on Tuesday, May 9, 2023, at 3:00 PM PT. |
Q1 2023 TG Therapeutics Inc Earnings CallQ1 2023 TG Therapeutics Inc Earnings Call |
Why Apellis Pharmaceuticals, TG Therapeutics, and Viking Therapeutics Were on the Move TodayWith earnings season in full swing, biotechnology stocks were volatile today. Apellis Pharmaceuticals' (NASDAQ: APLS) stock, for instance, dipped by as much as 8.5% in early-morning trading Monday before rallying in the afternoon session. Viking Therapeutics (NASDAQ: VKTX) also joined the bull parade today, with its stock first rising by 7% in the early portion of Monday's session before cooling off to finish up by approximately 3.8%. |
TGTX Price Returns
1-mo | -24.52% |
3-mo | 53.29% |
6-mo | 200.11% |
1-year | 541.95% |
3-year | 40.52% |
5-year | 95.69% |
YTD | 122.49% |
2022 | -37.74% |
2021 | -63.48% |
2020 | 368.65% |
2019 | 170.73% |
2018 | -50.00% |
Continue Researching TGTX
Want to see what other sources are saying about Tg Therapeutics Inc's financials and stock price? Try the links below:Tg Therapeutics Inc (TGTX) Stock Price | Nasdaq
Tg Therapeutics Inc (TGTX) Stock Quote, History and News - Yahoo Finance
Tg Therapeutics Inc (TGTX) Stock Price and Basic Information | MarketWatch
Loading social stream, please wait...