
Hanover Insurance Group Inc (THG): Price and Financial Metrics
THG Price/Volume Stats
| Current price | $134.57 | 52-week high | $138.30 |
| Prev. close | $130.90 | 52-week low | $103.82 |
| Day low | $131.11 | Volume | 247,100 |
| Day high | $134.79 | Avg. volume | 173,434 |
| 50-day MA | $128.52 | Dividend yield | 2.58% |
| 200-day MA | $126.92 | Market Cap | 4.84B |
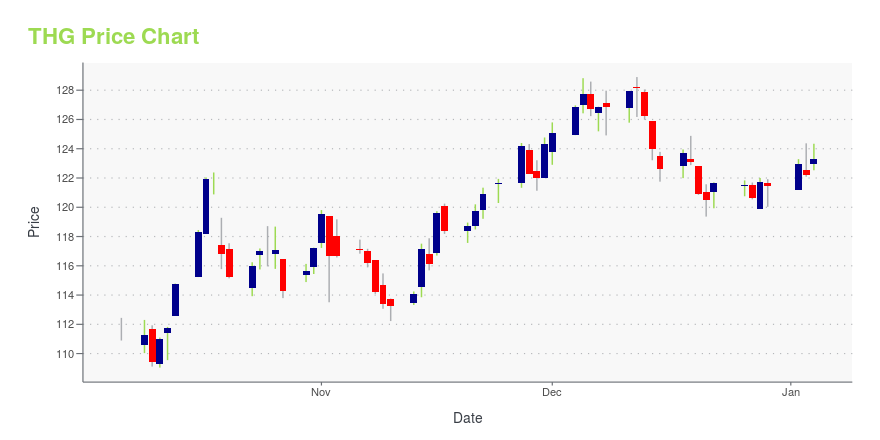
THG Stock Price Chart Interactive Chart >
Hanover Insurance Group Inc (THG) Company Bio
The Hanover Insurance Group, Inc. provides various property and casualty insurance products and services in the United States and internationally. It operates through four segments: Commercial Lines, Personal Lines, Chaucer, and Other. The company was founded in 1852 and is based in Worcester, Massachusetts.
Latest THG News From Around the Web
Below are the latest news stories about HANOVER INSURANCE GROUP INC that investors may wish to consider to help them evaluate THG as an investment opportunity.
The Hanover Insurance Group, Inc. to Issue Fourth Quarter Financial Results on January 31The Hanover Insurance Group, Inc. (NYSE: THG) expects to issue its fourth quarter and full-year financial results after the market closes on Wednesday, January 31, 2024. The company expects to webcast a discussion of its results on Thursday, February 1, at 10:00 a.m. ET, through its website at hanover.com. |
The Hanover Recognized By Newsweek as Most Responsible Company; Earns Top Score in Human Rights Campaign Foundation's Corporate Equality IndexThe Hanover Insurance Group, Inc. (NYSE: THG) recently was recognized by Newsweek as one of America's Most Responsible Companies for the third consecutive year and by the Human Rights Campaign Foundation for receiving a score of 100 on its Corporate Equality Index for the sixth consecutive year. |
Don't Race Out To Buy The Hanover Insurance Group, Inc. (NYSE:THG) Just Because It's Going Ex-DividendSome investors rely on dividends for growing their wealth, and if you're one of those dividend sleuths, you might be... |
Hanover Insurance Group's (NYSE:THG) Upcoming Dividend Will Be Larger Than Last Year'sThe Hanover Insurance Group, Inc. ( NYSE:THG ) will increase its dividend on the 29th of December to $0.85, which is... |
The Hanover Insurance Group, Inc. Increases Quarterly Dividend to $0.85 Per Common ShareThe Hanover Insurance Group, Inc. (NYSE: THG) announced today its board of directors has approved an increase in the company's quarterly dividend to $0.85 per share on the issued and outstanding common stock of the company, payable December 29, 2023, to shareholders of record at the close of business on December 15, 2023. |
THG Price Returns
| 1-mo | 10.10% |
| 3-mo | 4.56% |
| 6-mo | 4.20% |
| 1-year | 21.91% |
| 3-year | 10.44% |
| 5-year | 18.05% |
| YTD | 12.32% |
| 2023 | -7.61% |
| 2022 | 5.40% |
| 2021 | 14.51% |
| 2020 | -12.31% |
| 2019 | 26.73% |
THG Dividends
| Ex-Dividend Date | Type | Payout Amount | Change | ||||||
|---|---|---|---|---|---|---|---|---|---|
| Loading, please wait... | |||||||||
Continue Researching THG
Want to see what other sources are saying about Hanover Insurance Group Inc's financials and stock price? Try the links below:Hanover Insurance Group Inc (THG) Stock Price | Nasdaq
Hanover Insurance Group Inc (THG) Stock Quote, History and News - Yahoo Finance
Hanover Insurance Group Inc (THG) Stock Price and Basic Information | MarketWatch
Loading social stream, please wait...