Thermogenesis Holdings, Inc. (THMO): Price and Financial Metrics
THMO Price/Volume Stats
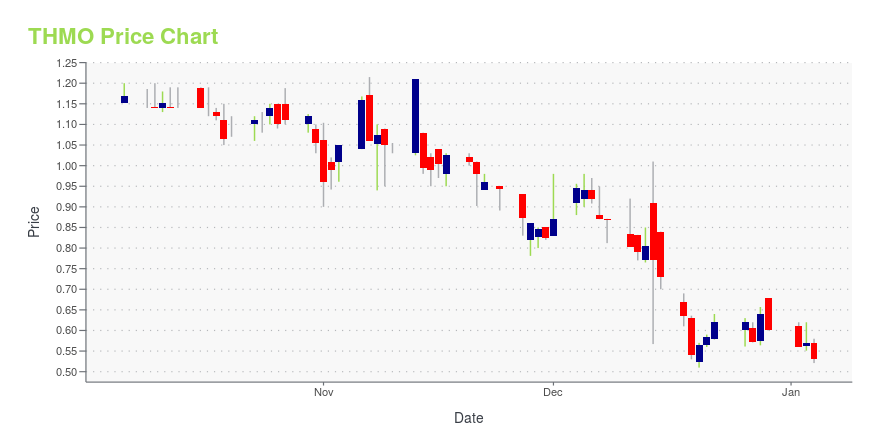
Current price | $1.21 | 52-week high | $14.40 |
Prev. close | $1.38 | 52-week low | $1.03 |
Day low | $1.19 | Volume | 45,600 |
Day high | $1.36 | Avg. volume | 480,723 |
50-day MA | $1.25 | Dividend yield | N/A |
200-day MA | $2.26 | Market Cap | 3.00M |
THMO Stock Price Chart Interactive Chart >
THMO POWR Grades
- THMO scores best on the Value dimension, with a Value rank ahead of 95.66% of US stocks.
- THMO's strongest trending metric is Value; it's been moving up over the last 127 days.
- THMO ranks lowest in Stability; there it ranks in the 5th percentile.
THMO Stock Summary
- THMO has a market capitalization of $2,991,169 -- more than approximately merely 1.41% of US stocks.
- In terms of volatility of its share price, THMO is more volatile than 93.21% of stocks we're observing.
- Shareholder yield, a measure of how much is returned to shareholders via dividends and share repurchases, for THMO comes in at -187.22% -- higher than that of just 3.11% of stocks in our set.
- If you're looking for stocks that are quantitatively similar to THERMOGENESIS HOLDINGS INC, a group of peers worth examining would be NMRD, OI, BVN, MPAA, and BAK.
- THMO's SEC filings can be seen here. And to visit THERMOGENESIS HOLDINGS INC's official web site, go to www.thermogenesis.com.
THMO Valuation Summary
- In comparison to the median Healthcare stock, THMO's price/sales ratio is 92.5% lower, now standing at 0.3.
- THMO's price/sales ratio has moved down 12.1 over the prior 243 months.
Below are key valuation metrics over time for THMO.
Stock | Date | P/S | P/B | P/E | EV/EBIT |
---|---|---|---|---|---|
THMO | 2023-09-22 | 0.3 | 0.8 | -0.2 | -1.5 |
THMO | 2023-09-21 | 0.3 | 0.8 | -0.2 | -1.5 |
THMO | 2023-09-20 | 0.3 | 0.8 | -0.2 | -1.5 |
THMO | 2023-09-19 | 0.3 | 0.8 | -0.2 | -1.5 |
THMO | 2023-09-18 | 0.3 | 0.8 | -0.2 | -1.5 |
THMO | 2023-09-15 | 0.3 | 0.8 | -0.2 | -1.5 |
THMO Growth Metrics
- Its year over year net income to common stockholders growth rate is now at 23.2%.
- The 5 year net income to common stockholders growth rate now stands at 61.35%.
- Its 3 year revenue growth rate is now at -3.04%.

The table below shows THMO's growth in key financial areas (numbers in millions of US dollars).
Date | Revenue | Operating Cash Flow | Net Income to Common Stock |
---|---|---|---|
2022-09-30 | 10.225 | -6.427 | -10.492 |
2022-06-30 | 11.268 | -6.477 | -9.026 |
2022-03-31 | 10.44 | -6.827 | -10.877 |
2021-12-31 | 9.294 | -6.62 | -11.379 |
2021-09-30 | 8.823 | -8.828 | -11.575 |
2021-06-30 | 8.02 | -10.684 | -12.264 |
THMO's Quality Factors
The “Quality” component of the POWR Ratings focuses on 31 different factors of a companies fundamentals and operational strength. Here are some key insights as we drill into the specifics of these quality attributes.- THMO has a Quality Grade of D, ranking ahead of 11.36% of graded US stocks.
- THMO's asset turnover comes in at 0.381 -- ranking 53rd of 75 Measuring and Control Equipment stocks.
- COHU, MKSI, and KLAC are the stocks whose asset turnover ratios are most correlated with THMO.
The table below shows THMO's key quality metrics over time.
Period | Asset Turnover | Gross Margin | ROIC |
---|---|---|---|
2021-06-30 | 0.381 | 0.510 | -0.584 |
2021-03-31 | 0.398 | 0.059 | -0.764 |
2020-12-31 | 0.513 | 0.129 | -0.788 |
2020-09-30 | 0.542 | 0.101 | -1.088 |
2020-06-30 | 0.636 | 0.120 | -1.093 |
2020-03-31 | 0.784 | 0.446 | -0.594 |
THMO Price Target
For more insight on analysts targets of THMO, see our THMO price target page. And for a list of of all stocks sorted by upside potential based on analyst target price, see our Top Price Target page.
Average Price Target | $6.00 | Average Broker Recommendation | 1.5 (Moderate Buy) |
Thermogenesis Holdings, Inc. (THMO) Company Bio
Thermogenesis Holdings, Inc. serves customers in the United States.
Latest THMO News From Around the Web
Below are the latest news stories about THERMOGENESIS HOLDINGS INC that investors may wish to consider to help them evaluate THMO as an investment opportunity.
ThermoGenesis Holdings, Inc. (NASDAQ:THMO) Q2 2023 Earnings Call TranscriptThermoGenesis Holdings, Inc. (NASDAQ:THMO) Q2 2023 Earnings Call Transcript August 11, 2023 Operator: Good day, and welcome to the ThermoGenesis Holdings conference call and webcast to review financial and operating results for the second quarter ended June 30, 2023. [Operator Instructions]. As a reminder, this conference call is being recorded. I would now like to […] |
Q2 2023 Thermogenesis Holdings Inc Earnings CallQ2 2023 Thermogenesis Holdings Inc Earnings Call |
ThermoGenesis Holdings Announces Second Quarter 2023 Financial Results and Provides Corporate UpdateThermoGenesis Holdings, Inc. (Nasdaq: THMO), a market leader in automated cell processing tools and services in the cell and gene therapy field, today reported financial and operating results for the second quarter ended June 30, 2023, and provided a corporate business update. |
ThermoGenesis Holdings to Announce Financial Results for the Second Quarter ended June 30, 2023 and Provide a Corporate Strategic UpdateThermoGenesis Holdings, Inc. (Nasdaq: THMO), a market leader in automated cell processing tools and services in the cell and gene therapy field, today announced that the Company will release its financial results for the second quarter ended June 30, 2023, and provide a corporate strategic update on Thursday, August 10, 2023, after the close of trading. A conference call and webcast will follow at 1:30 p.m. PT/ 4:30 p.m. ET. |
ThermoGenesis Expands Board of Directors with the Appointments of Dr. Biao Xi and Dr. James XuThermoGenesis Holdings, Inc. (Nasdaq: THMO), a market leader in automated cell processing tools and services in the cell and gene therapy field, today announced the appointments of Biao Xi, Ph.D. and James Xu, Esq., DBA, PsyD., J.D., CPA to its Board, effective July 17, 2023. Both are independent directors. The appointments expand ThermoGenesis' Board to seven members. |
THMO Price Returns
1-mo | 3.42% |
3-mo | -5.47% |
6-mo | -47.40% |
1-year | -89.28% |
3-year | -99.04% |
5-year | -99.37% |
YTD | -62.19% |
2022 | -92.96% |
2021 | -51.67% |
2020 | -52.50% |
2019 | 64.79% |
2018 | -91.10% |
Loading social stream, please wait...