
Thor Industries, Inc. (THO): Price and Financial Metrics
THO Price/Volume Stats
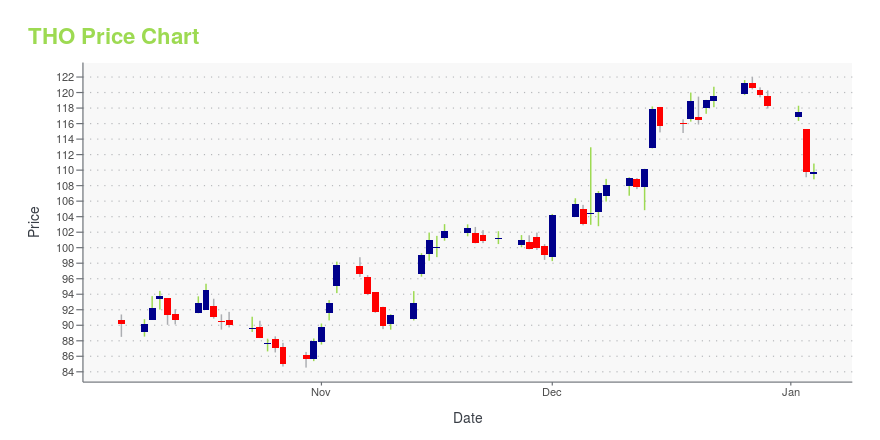
| Current price | $103.44 | 52-week high | $129.31 |
| Prev. close | $102.37 | 52-week low | $84.54 |
| Day low | $102.67 | Volume | 488,876 |
| Day high | $104.99 | Avg. volume | 498,016 |
| 50-day MA | $96.16 | Dividend yield | 1.94% |
| 200-day MA | $104.40 | Market Cap | 5.50B |
THO Stock Price Chart Interactive Chart >
Thor Industries, Inc. (THO) Company Bio
Thor Industries designs, manufactures, and sells a range of recreational vehicles, and related parts and accessories in the United States and Canada. It operates through two segments, Towable Recreational Vehicles and Motorized Recreational Vehicles. The company was founded in 1980 and is based in Elkhart, Indiana.
Latest THO News From Around the Web
Below are the latest news stories about THOR INDUSTRIES INC that investors may wish to consider to help them evaluate THO as an investment opportunity.
Thor Industries Inc's Dividend AnalysisThor Industries Inc(NYSE:THO) recently announced a dividend of $0.48 per share, payable on 2024-01-11, with the ex-dividend date set for 2023-12-27. As investors look forward to this upcoming payment, the spotlight also shines on the company's dividend history, yield, and growth rates. Using the data from GuruFocus, let's look into Thor Industries Inc's dividend performance and assess its sustainability. |
THOR Industries, Inc. (NYSE:THO) Pays A US$0.48 Dividend In Just Four DaysTHOR Industries, Inc. ( NYSE:THO ) stock is about to trade ex-dividend in four days. The ex-dividend date occurs one... |
Will Winnebago (WGO) Upset Investors This Earnings Season?The consensus mark for Winnebago's (WGO) fiscal first-quarter EPS and revenues is pegged at $1.25 and $738.6 million, implying a year-over-year decline of 40% and 22.4%, respectively. |
THOR Industries Announces Regular Quarterly DividendELKHART, Ind., Dec. 14, 2023 (GLOBE NEWSWIRE) -- THOR Industries, Inc. (NYSE: THO) today announced that its Board of Directors approved, at its December 14, 2023 meeting, the payment of a regular quarterly cash dividend of $0.48 per share. The regular cash dividend is payable on January 11, 2024, to shareholders of record at the close of business on December 28, 2023. About THOR Industries, Inc. THOR is the sole owner of operating companies which, combined, represent the world's largest manufact |
Auto Roundup: F Invests in Nickel Plant, STLA Collaborates With Ample & MoreWhile Ford (F) invests in a nickel plant in Indonesia to strengthen its EV supply chain, Stellantis (STLA) joins forces with Ample to integrate the latter's Modular Battery Swapping technology in its EVs. |
THO Price Returns
| 1-mo | 14.99% |
| 3-mo | 3.36% |
| 6-mo | -8.08% |
| 1-year | -5.76% |
| 3-year | -2.49% |
| 5-year | 91.70% |
| YTD | -11.70% |
| 2023 | 59.77% |
| 2022 | -25.57% |
| 2021 | 13.26% |
| 2020 | 27.97% |
| 2019 | 46.47% |
THO Dividends
| Ex-Dividend Date | Type | Payout Amount | Change | ||||||
|---|---|---|---|---|---|---|---|---|---|
| Loading, please wait... | |||||||||
Continue Researching THO
Want to see what other sources are saying about Thor Industries Inc's financials and stock price? Try the links below:Thor Industries Inc (THO) Stock Price | Nasdaq
Thor Industries Inc (THO) Stock Quote, History and News - Yahoo Finance
Thor Industries Inc (THO) Stock Price and Basic Information | MarketWatch
Loading social stream, please wait...