Thermon Group Holdings, Inc. (THR): Price and Financial Metrics
GET POWR RATINGS... FREE!
THR POWR Grades
- THR scores best on the Sentiment dimension, with a Sentiment rank ahead of 97.88% of US stocks.
- The strongest trend for THR is in Quality, which has been heading up over the past 179 days.
- THR's current lowest rank is in the Momentum metric (where it is better than 53.2% of US stocks).
THR Stock Summary
- THR's current price/earnings ratio is 47.7, which is higher than 84.09% of US stocks with positive earnings.
- In terms of twelve month growth in earnings before interest and taxes, Thermon Group Holdings Inc is reporting a growth rate of 158.58%; that's higher than 87.34% of US stocks.
- In terms of volatility of its share price, THR is more volatile than only 5.32% of stocks we're observing.
- Stocks that are quantitatively similar to THR, based on their financial statements, market capitalization, and price volatility, are BV, ENS, ACCO, FLOW, and IBP.
- Visit THR's SEC page to see the company's official filings. To visit the company's web site, go to www.thermon.com.
THR Valuation Summary
- In comparison to the median Industrials stock, THR's price/earnings ratio is 162.57% higher, now standing at 68.4.
- THR's price/earnings ratio has moved up 92.2 over the prior 126 months.
- Over the past 126 months, THR's price/sales ratio has gone up 0.3.
Below are key valuation metrics over time for THR.
Stock | Date | P/S | P/B | P/E | EV/EBIT |
---|---|---|---|---|---|
THR | 2021-08-26 | 1.9 | 1.4 | 68.4 | 32.6 |
THR | 2021-08-25 | 1.9 | 1.4 | 68.5 | 32.7 |
THR | 2021-08-24 | 1.9 | 1.4 | 68.7 | 32.8 |
THR | 2021-08-23 | 1.9 | 1.4 | 67.8 | 32.4 |
THR | 2021-08-20 | 1.9 | 1.4 | 67.5 | 32.3 |
THR | 2021-08-19 | 1.9 | 1.4 | 66.9 | 32.1 |
THR Growth Metrics
- The 3 year net income to common stockholders growth rate now stands at -1.1%.
- The 3 year net cashflow from operations growth rate now stands at -51.53%.
- The year over year cash and equivalents growth rate now stands at -7.2%.

The table below shows THR's growth in key financial areas (numbers in millions of US dollars).
Date | Revenue | Operating Cash Flow | Net Income to Common Stock |
---|---|---|---|
2021-12-31 | 326.413 | 28.556 | 11.851 |
2021-09-30 | 305.404 | 28.136 | 6.756 |
2021-06-30 | 290.488 | 29.414 | 8.117 |
2021-03-31 | 276.181 | 30.289 | 1.165 |
2020-12-31 | 291.229 | 33.85 | -1.04 |
2020-09-30 | 312.093 | 53.28 | -0.693 |
THR's Quality Factors
The “Quality” component of the POWR Ratings focuses on 31 different factors of a companies fundamentals and operational strength. Here are some key insights as we drill into the specifics of these quality attributes.- THR has a Quality Grade of C, ranking ahead of 59.66% of graded US stocks.
- THR's asset turnover comes in at 0.463 -- ranking 32nd of 53 Electrical Equipment stocks.
- EMR, POLA, and PLUG are the stocks whose asset turnover ratios are most correlated with THR.
The table below shows THR's key quality metrics over time.
Period | Asset Turnover | Gross Margin | ROIC |
---|---|---|---|
2021-06-30 | 0.463 | 0.418 | 0.054 |
2021-03-31 | 0.441 | 0.425 | 0.025 |
2020-12-31 | 0.464 | 0.431 | 0.024 |
2020-09-30 | 0.496 | 0.423 | 0.027 |
2020-06-30 | 0.548 | 0.426 | 0.048 |
2020-03-31 | 0.591 | 0.421 | 0.073 |
THR Price Target
For more insight on analysts targets of THR, see our THR price target page. And for a list of of all stocks sorted by upside potential based on analyst target price, see our Top Price Target page.
Average Price Target | $24.00 | Average Broker Recommendation | 1 (Strong Buy) |
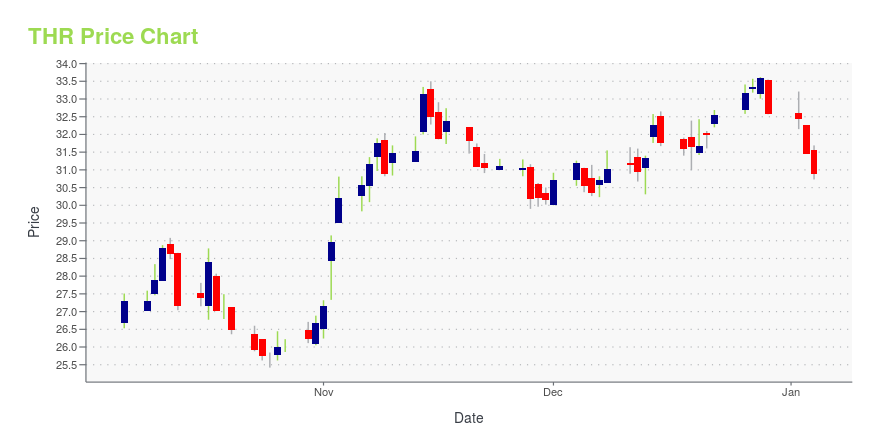
THR Stock Price Chart Interactive Chart >
THR Price/Volume Stats
Current price | $18.85 | 52-week high | $20.35 |
Prev. close | $17.95 | 52-week low | $13.26 |
Day low | $17.67 | Volume | 49,615 |
Day high | $18.91 | Avg. volume | 103,513 |
50-day MA | $15.30 | Dividend yield | N/A |
200-day MA | $16.52 | Market Cap | 631.00M |
Thermon Group Holdings, Inc. (THR) Company Bio
Thermon Group Holdings provides highly engineered thermal solutions, known as heat tracing, for process industries, including energy, chemical processing and power generation. Thermon's products provide an external heat source to pipes, vessels and instruments for the purposes of freeze protection, temperature maintenance, environmental monitoring and surface snow and ice melting. The company was founded in 1954 and is based in San Marcos, Texas.
Latest THR News From Around the Web
Below are the latest news stories about Thermon Group Holdings Inc that investors may wish to consider to help them evaluate THR as an investment opportunity.
Investors Could Be Concerned With Thermon Group Holdings' (NYSE:THR) Returns On CapitalIf you're looking for a multi-bagger, there's a few things to keep an eye out for. One common approach is to try and... |
Thermon Group (THR) Upgraded to Buy: What Does It Mean for the Stock?Thermon Group (THR) might move higher on growing optimism about its earnings prospects, which is reflected by its upgrade to a Zacks Rank #2 (Buy). |
Thermon Group (THR) Beats Q3 Earnings and Revenue EstimatesThermon Group (THR) delivered earnings and revenue surprises of 2.78% and 3.99%, respectively, for the quarter ended December 2021. Do the numbers hold clues to what lies ahead for the stock? |
Thermon Reports Third Quarter Fiscal 2022 Results* Revenue growth of 26% driven by improving North American customer activity * Orders up 31% and Book to Bill of 1.02x, excluding a large, one-time contract * Net Income up 82% due to increased volume and refinancing savings * Raising full-year Fiscal 2022 revenue guidance to $342-$350 million due to backlog strength and incoming order rate trendsAUSTIN, TX / ACCESSWIRE / February 3, 2022 / Thermon Group Holdings, Inc. |
Transcat, Inc. (TRNS) Lags Q3 Earnings and Revenue EstimatesTranscat, Inc. (TRNS) delivered earnings and revenue surprises of -8.70% and 0.51%, respectively, for the quarter ended December 2021. Do the numbers hold clues to what lies ahead for the stock? |
THR Price Returns
1-mo | 34.26% |
3-mo | 27.36% |
6-mo | 8.77% |
1-year | 9.78% |
3-year | -16.22% |
5-year | 11.14% |
YTD | 11.34% |
2021 | 8.32% |
2020 | -41.68% |
2019 | 32.15% |
2018 | -14.32% |
2017 | 23.99% |
Continue Researching THR
Here are a few links from around the web to help you further your research on Thermon Group Holdings Inc's stock as an investment opportunity:Thermon Group Holdings Inc (THR) Stock Price | Nasdaq
Thermon Group Holdings Inc (THR) Stock Quote, History and News - Yahoo Finance
Thermon Group Holdings Inc (THR) Stock Price and Basic Information | MarketWatch
Loading social stream, please wait...