
Tiptree Inc. (TIPT): Price and Financial Metrics
TIPT Price/Volume Stats
| Current price | $19.19 | 52-week high | $20.80 |
| Prev. close | $18.73 | 52-week low | $14.30 |
| Day low | $18.88 | Volume | 63,587 |
| Day high | $19.24 | Avg. volume | 101,933 |
| 50-day MA | $17.18 | Dividend yield | 1.31% |
| 200-day MA | $17.37 | Market Cap | 705.90M |
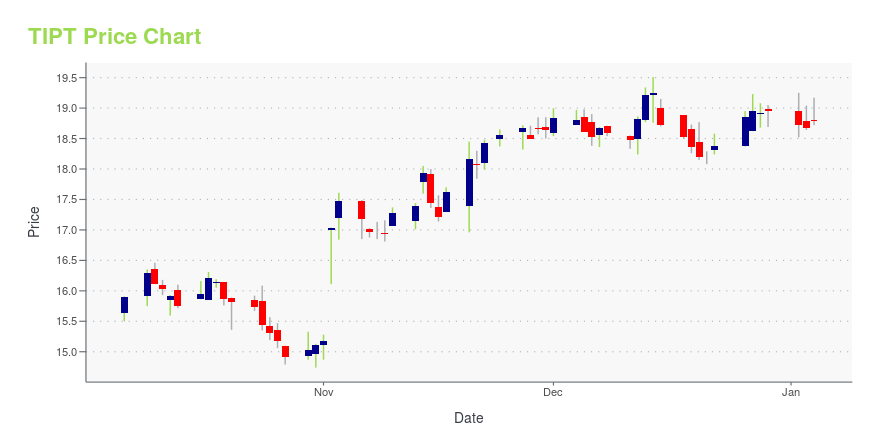
TIPT Stock Price Chart Interactive Chart >
Tiptree Inc. (TIPT) Company Bio
Tiptree Financial Inc. has subsidiaries that operate in four industries: insurance and insurance services, specialty finance, asset management and real estate. The company was founded in 2007 and is based in New York, New York.
Latest TIPT News From Around the Web
Below are the latest news stories about TIPTREE INC that investors may wish to consider to help them evaluate TIPT as an investment opportunity.
AM Best Affirms Credit Ratings of The Fortegra Group, Inc.’s Insurance SubsidiariesOLDWICK, N.J., December 08, 2023--AM Best has affirmed the Financial Strength Rating (FSR) of A- (Excellent) and the Long-Term Issuer Credit Ratings (Long-Term ICRs) of "a-" (Excellent) of the operating subsidiaries of The Fortegra Group, Inc. (Fortegra) (headquartered in Jacksonville, FL). Fortegra is a wholly owned subsidiary of its publicly traded parent company, Tiptree Inc. [NASDAQ: TIPT]. The property/casualty (P/C) operating subsidiaries of Fortegra include: Lyndon Southern Insurance Comp |
With 42% ownership, Tiptree Inc. (NASDAQ:TIPT) insiders have a lot riding on the company's futureKey Insights Significant insider control over Tiptree implies vested interests in company growth The top 5 shareholders... |
We Wouldn't Be Too Quick To Buy Tiptree Inc. (NASDAQ:TIPT) Before It Goes Ex-DividendRegular readers will know that we love our dividends at Simply Wall St, which is why it's exciting to see Tiptree Inc... |
Tiptree Announces Fortegra Filing of Registration Statement for Initial Public OfferingGREENWICH, Conn., November 08, 2023--Tiptree Inc. ("Tiptree") (NASDAQ:TIPT) today announced that its specialty insurance subsidiary, The Fortegra Group, Inc. ("Fortegra") has publicly filed a Registration Statement on Form S-1 (the "Registration Statement") with the Securities and Exchange Commission (the "SEC") relating to a proposed initial public offering ("IPO"). Tiptree expects Fortegra’s IPO to be a primary offering with the net proceeds used to execute its growth strategy and for working |
Corvid Peak Capital Management Announces Closing of Coherence Capital Management Team AcquisitionNEW YORK & GREENWICH, Conn., November 06, 2023--Corvid Peak Capital Management, a subsidiary of Tiptree Inc. (NASDAQ:TIPT) ("Tiptree" or the "Company") today reported that it has closed the previously announced acquisition of the Coherence Capital Management team ("Coherence"). |
TIPT Price Returns
| 1-mo | 19.71% |
| 3-mo | 20.58% |
| 6-mo | 0.97% |
| 1-year | 29.11% |
| 3-year | 105.87% |
| 5-year | 219.09% |
| YTD | 1.93% |
| 2023 | 38.80% |
| 2022 | 1.39% |
| 2021 | 179.66% |
| 2020 | -36.51% |
| 2019 | 49.03% |
TIPT Dividends
| Ex-Dividend Date | Type | Payout Amount | Change | ||||||
|---|---|---|---|---|---|---|---|---|---|
| Loading, please wait... | |||||||||
Continue Researching TIPT
Here are a few links from around the web to help you further your research on Tiptree Inc's stock as an investment opportunity:Tiptree Inc (TIPT) Stock Price | Nasdaq
Tiptree Inc (TIPT) Stock Quote, History and News - Yahoo Finance
Tiptree Inc (TIPT) Stock Price and Basic Information | MarketWatch
Loading social stream, please wait...