Titan Machinery Inc. (TITN): Price and Financial Metrics


Titan Machinery Inc. (TITN): $28.70

-0.33 (-1.14%)

POWR Rating

Component Grades

Growth

S

Value

I

Momentum

G

Stability

N

Sentiment

U

Quality

P

TITN POWR Grades

  • Momentum is the dimension where TITN ranks best; there it ranks ahead of 90.09% of US stocks.
  • TITN's strongest trending metric is Momentum; it's been moving up over the last 178 days.
  • TITN's current lowest rank is in the Stability metric (where it is better than 15.86% of US stocks).

TITN Stock Summary

  • The capital turnover (annual revenue relative to shareholder's equity) for TITN is 4.17 -- better than 88.61% of US stocks.
  • TITN's price/sales ratio is 0.32; that's higher than the P/S ratio of merely 11.35% of US stocks.
  • Over the past twelve months, TITN has reported earnings growth of 116.26%, putting it ahead of 87.99% of US stocks in our set.
  • If you're looking for stocks that are quantitatively similar to TITAN MACHINERY INC, a group of peers worth examining would be FOSL, LL, IMKTA, CNXN, and FIX.
  • Visit TITN's SEC page to see the company's official filings. To visit the company's web site, go to www.titanmachinery.com.

TITN Valuation Summary

  • TITN's price/earnings ratio is 6.4; this is 66.49% lower than that of the median Industrials stock.
  • TITN's price/sales ratio has moved down 0.1 over the prior 186 months.

Below are key valuation metrics over time for TITN.

Stock Date P/S P/B P/E EV/EBIT
TITN 2023-03-17 0.3 1.3 6.4 5.4
TITN 2023-03-16 0.3 1.4 6.8 5.6
TITN 2023-03-15 0.4 1.8 8.5 6.8
TITN 2023-03-14 0.4 1.9 9.0 7.2
TITN 2023-03-13 0.4 1.8 8.6 6.9
TITN 2023-03-10 0.5 1.9 9.3 7.4

TITN Growth Metrics

    Its 5 year cash and equivalents growth rate is now at -9.61%.
  • The year over year net income to common stockholders growth rate now stands at 164.25%.
  • Its year over year price growth rate is now at -18.22%.
TITN's revenue has moved up $586,033,000 over the prior 15 months.

The table below shows TITN's growth in key financial areas (numbers in millions of US dollars).

Date Revenue Operating Cash Flow Net Income to Common Stock
2022-09-30 2,133.918 79.507 106.191
2022-06-30 1,919.12 109.402 86.75
2022-03-31 1,800.207 137.281 73.04
2021-12-31 1,711.906 158.916 66.047
2021-09-30 1,640.988 184.457 44.394
2021-06-30 1,547.885 188.522 32.49

TITN's Quality Factors

The “Quality” component of the POWR Ratings focuses on 31 different factors of a companies fundamentals and operational strength. Here are some key insights as we drill into the specifics of these quality attributes.
  • TITN has a Quality Grade of C, ranking ahead of 54.44% of graded US stocks.
  • TITN's asset turnover comes in at 1.828 -- ranking 57th of 165 Retail stocks.
  • GPI, SAH, and AN are the stocks whose asset turnover ratios are most correlated with TITN.

The table below shows TITN's key quality metrics over time.

Period Asset Turnover Gross Margin ROIC
2021-07-31 1.828 0.185 0.094
2021-04-30 1.686 0.186 0.083
2021-01-31 1.553 0.185 0.064
2020-10-31 1.397 0.192 0.049
2020-07-31 1.352 0.192 0.048
2020-04-30 1.336 0.191 0.048

TITN Price Target

For more insight on analysts targets of TITN, see our TITN price target page. And for a list of of all stocks sorted by upside potential based on analyst target price, see our Top Price Target page.

Average Price Target $37.33 Average Broker Recommendation 1.12 (Strong Buy)

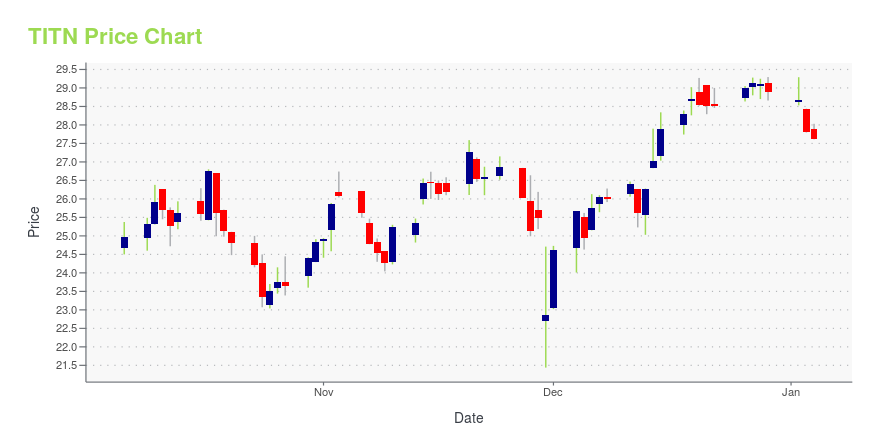
TITN Stock Price Chart Interactive Chart >

Price chart for TITN

TITN Price/Volume Stats

Current price $28.70 52-week high $47.87
Prev. close $29.03 52-week low $21.50
Day low $28.65 Volume 799,300
Day high $30.18 Avg. volume 299,957
50-day MA $42.60 Dividend yield N/A
200-day MA $34.06 Market Cap 651.69M

Titan Machinery Inc. (TITN) Company Bio


Titan Machinery Inc. owns and operates a network of full service agricultural and construction equipment stores in the United States and Europe. The company operates through three segments: Agriculture, Construction, and International. The company was founded in 1980 and based in West Fargo, North Dakota.


TITN Latest News Stream


Event/Time News Detail
Loading, please wait...

TITN Latest Social Stream


Loading social stream, please wait...

View Full TITN Social Stream

Latest TITN News From Around the Web

Below are the latest news stories about TITAN MACHINERY INC that investors may wish to consider to help them evaluate TITN as an investment opportunity.

Titan Machinery (TITN) Q4 Earnings Miss Estimates, Dip Y/Y

Titan Machinery's (TITN) fourth-quarter results reflect declines in the Construction and International segments.

Yahoo | March 17, 2023

Q4 2023 Titan Machinery Inc Earnings Call

Q4 2023 Titan Machinery Inc Earnings Call

Yahoo | March 17, 2023

Why Titan Machinery Stock Crashed 22% Today

Shares of construction and agricultural equipment manufacturer Titan Machinery (NASDAQ: TITN) collapsed after the company reported a big earnings and sales miss on Thursday. Wall Street had expected Titan to report $1.13 per share in adjusted earnings on sales of $684.4 million, but Titan actually reported only $0.81 per share (adjusted -- GAAP profits were $0.80 per share) on sales of $583 million. As of 9:55 a.m. ET, Titan shares are down 22.2%.

Yahoo | March 16, 2023

Titan Machinery Inc. Announces Results for Fiscal Fourth Quarter and Full Year Ended January 31, 2023

- Revenue for Fiscal 2023 Increased 29.1% to $2.2 billion - - Record Fiscal 2023 GAAP EPS of $4.49 and Adjusted EPS of $4.52, an increase of 53.8% and 51.7%, respectively - WEST FARGO, N.D., March 16, 2023 (GLOBE NEWSWIRE) -- Titan Machinery Inc. (Nasdaq: TITN), a leading network of full-service agricultural and construction equipment stores, today reported financial results for the fiscal fourth quarter and full year ended January 31, 2023. David Meyer, Titan Machinery’s Chairman and Chief Exec

Yahoo | March 16, 2023

Titan Machinery (TITN) Hits 52-Week High: What's Aiding it?

Titan Machinery (TITN) gains from strong demand, solid performances and upbeat outlook ahead of earnings.

Yahoo | March 9, 2023

Read More 'TITN' Stories Here

TITN Price Returns

1-mo N/A
3-mo -24.69%
6-mo 8.22%
1-year -16.20%
3-year 251.72%
5-year 49.79%
YTD -27.76%
2022 17.93%
2021 72.33%
2020 32.27%
2019 12.40%
2018 -37.88%

Get Free Updates

Join thousands of investors who get the latest news, insights and top rated picks from StockNews.com!


Page generated in 0.7955 seconds.