
Tivic Health Systems, Inc. (TIVC): Price and Financial Metrics
TIVC Price/Volume Stats
| Current price | $0.45 | 52-week high | $11.46 |
| Prev. close | $0.41 | 52-week low | $0.28 |
| Day low | $0.38 | Volume | 58,412,785 |
| Day high | $0.85 | Avg. volume | 1,278,174 |
| 50-day MA | $0.39 | Dividend yield | N/A |
| 200-day MA | $1.16 | Market Cap | 2.80M |
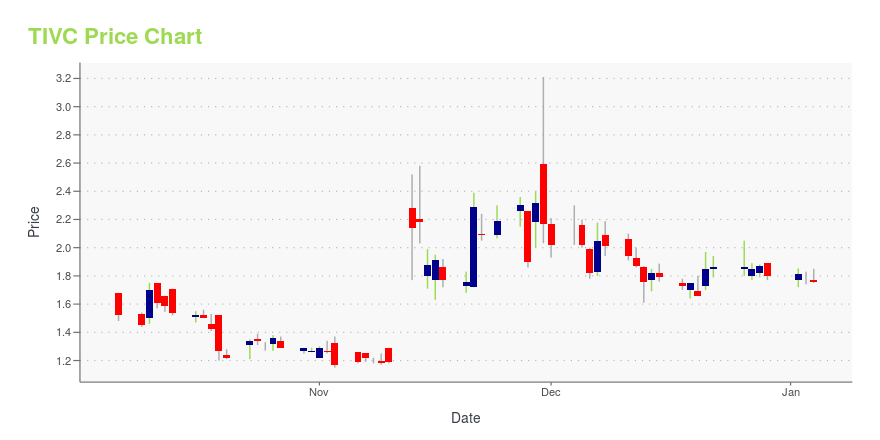
TIVC Stock Price Chart Interactive Chart >
Tivic Health Systems, Inc. (TIVC) Company Bio
Tivic Health Systems Inc. operates as a bioelectronic device company that delivers non-invasive neuromodulation products for the treatment of inflammatory conditions. The company's primary product, ClearUP, is a medical device intended to relieve sinus and nasal inflammation. It sells its products on direct-to-consumer channel through its own websites and platforms, such as Amazon.com, as well as to major U.S. online retailers, such as BestBuy.com, FSAStore.com, Walgreens.com, Walmart.com. The company was incorporated in 2016 and is headquartered in Newark, California.
Latest TIVC News From Around the Web
Below are the latest news stories about TIVIC HEALTH SYSTEMS INC that investors may wish to consider to help them evaluate TIVC as an investment opportunity.
Today’s Biggest Pre-Market Stock Movers: 10 Top Gainers and Losers on WednesdayIt's time to dive into the biggest pre-market stock movers as we check out all of the hottest news worth reading about on Wednesday! |
Tivic Health Systems, Inc. (TIVC) Reports Q3 Loss, Misses Revenue EstimatesTivic Health Systems, Inc. (TIVC) delivered earnings and revenue surprises of 78.86% and 63.85%, respectively, for the quarter ended September 2023. Do the numbers hold clues to what lies ahead for the stock? |
Tivic Reports Third Quarter 2023 Financial ResultsSAN FRANCISCO, November 14, 2023--Tivic Health® Systems, Inc. ("Tivic", Nasdaq: TIVC), a health tech company that develops and commercializes bioelectronic medicine, announced its financial results for the third quarter 2023 ended September 30, 2023 ("Q3 2023"). |
Why Is Tivic Health (TIVC) Stock Up 63% Today?Tivic Health stock is rising alongside with heavy trading of TIVC shares on Monday as investors prepare for its upcoming earnings report. |
Today’s Biggest Pre-Market Stock Movers: 10 Top Gainers and Losers on MondayPre-market stock movers are worth checking out on Monday as we cover all of the biggest gainers and losers this morning! |
TIVC Price Returns
| 1-mo | 12.50% |
| 3-mo | -56.73% |
| 6-mo | -66.42% |
| 1-year | -90.70% |
| 3-year | N/A |
| 5-year | N/A |
| YTD | -75.00% |
| 2023 | -97.19% |
| 2022 | -83.51% |
| 2021 | N/A |
| 2020 | N/A |
| 2019 | N/A |
Loading social stream, please wait...