TJX Cos. (TJX): Price and Financial Metrics
GET POWR RATINGS... FREE!
TJX POWR Grades
- Quality is the dimension where TJX ranks best; there it ranks ahead of 89.93% of US stocks.
- TJX's strongest trending metric is Stability; it's been moving up over the last 179 days.
- TJX's current lowest rank is in the Momentum metric (where it is better than 39.93% of US stocks).
TJX Stock Summary
- With a market capitalization of $76,714,009,518, Tjx Companies Inc has a greater market value than 96.55% of US stocks.
- Tjx Companies Inc's capital turnover -- a measure of revenue relative to shareholder's equity -- is better than 95.39% of US listed stocks.
- Over the past twelve months, TJX has reported earnings growth of 264.36%, putting it ahead of 91.92% of US stocks in our set.
- Stocks that are quantitatively similar to TJX, based on their financial statements, market capitalization, and price volatility, are MMC, SHW, PGR, ITW, and MDLZ.
- TJX's SEC filings can be seen here. And to visit Tjx Companies Inc's official web site, go to www.tjx.com.
TJX Valuation Summary
- TJX's price/sales ratio is 2; this is 42.86% higher than that of the median Consumer Cyclical stock.
- TJX's EV/EBIT ratio has moved up 15.6 over the prior 243 months.
- Over the past 243 months, TJX's price/sales ratio has gone up 1.
Below are key valuation metrics over time for TJX.
Stock | Date | P/S | P/B | P/E | EV/EBIT |
---|---|---|---|---|---|
TJX | 2021-08-27 | 2.0 | 13.8 | 35.3 | 27.2 |
TJX | 2021-08-26 | 2.4 | 14.5 | 58.9 | 40.4 |
TJX | 2021-08-25 | 2.4 | 14.9 | 60.5 | 41.4 |
TJX | 2021-08-24 | 2.4 | 14.8 | 60.1 | 41.1 |
TJX | 2021-08-23 | 2.4 | 14.8 | 60.0 | 41.1 |
TJX | 2021-08-20 | 2.4 | 14.6 | 59.1 | 40.5 |
TJX Growth Metrics
- The 5 year cash and equivalents growth rate now stands at 120.55%.
- Its 2 year net cashflow from operations growth rate is now at -77.08%.
- Its 4 year price growth rate is now at 41.68%.

The table below shows TJX's growth in key financial areas (numbers in millions of US dollars).
Date | Revenue | Operating Cash Flow | Net Income to Common Stock |
---|---|---|---|
2021-09-30 | 45,638.82 | 2,232.062 | 2,668.134 |
2021-06-30 | 43,224.22 | 5,311.993 | 2,511.79 |
2021-03-31 | 37,814.74 | 7,289.645 | 1,511.889 |
2020-12-31 | 32,136.96 | 4,561.889 | 90.47 |
2020-09-30 | 33,400.21 | 6,469.772 | 749.737 |
2020-06-30 | 33,734.26 | 3,364.071 | 711.344 |
TJX's Quality Factors
The “Quality” component of the POWR Ratings focuses on 31 different factors of a companies fundamentals and operational strength. Here are some key insights as we drill into the specifics of these quality attributes.- TJX has a Quality Grade of B, ranking ahead of 93.72% of graded US stocks.
- TJX's asset turnover comes in at 1.423 -- ranking 85th of 165 Retail stocks.
- ROST, BURL, and BBY are the stocks whose asset turnover ratios are most correlated with TJX.
The table below shows TJX's key quality metrics over time.
Period | Asset Turnover | Gross Margin | ROIC |
---|---|---|---|
2021-07-31 | 1.423 | 0.289 | 0.138 |
2021-05-01 | 1.268 | 0.276 | 0.091 |
2021-01-30 | 1.124 | 0.237 | 0.010 |
2020-10-31 | 1.241 | 0.240 | 0.038 |
2020-08-01 | 1.344 | 0.236 | 0.039 |
2020-05-02 | 1.524 | 0.250 | 0.079 |
TJX Price Target
For more insight on analysts targets of TJX, see our TJX price target page. And for a list of of all stocks sorted by upside potential based on analyst target price, see our Top Price Target page.
Average Price Target | $84.45 | Average Broker Recommendation | 1.46 (Moderate Buy) |
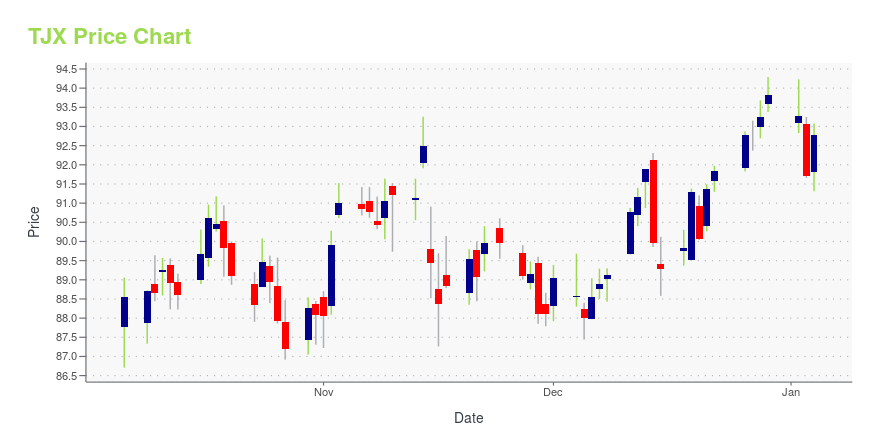
TJX Stock Price Chart Interactive Chart >
TJX Price/Volume Stats
Current price | $56.04 | 52-week high | $77.35 |
Prev. close | $55.85 | 52-week low | $53.69 |
Day low | $54.55 | Volume | 5,392,000 |
Day high | $56.12 | Avg. volume | 7,339,034 |
50-day MA | $59.90 | Dividend yield | 2.11% |
200-day MA | $65.84 | Market Cap | 65.66B |
TJX Cos. (TJX) Company Bio
The TJX Companies, Inc. (abbreviated TJX) is an American multinational off-price department store corporation, headquartered in Framingham, Massachusetts. It was formed as a subsidiary of Zayre Corp. in 1987, and became the legal successor to Zayre Corp. following a company reorganization in 1989. (Source:Wikipedia)
Latest TJX News From Around the Web
Below are the latest news stories about Tjx Companies Inc that investors may wish to consider to help them evaluate TJX as an investment opportunity.
TJX Earnings: Profit Headwinds Ramp Up in Q4The top off-price retailer missed analysts' earnings estimates despite strong sales growth last quarter. |
TJX Misses Q4 Expectations; Shares Fall 4%Shares of TJX Companies, Inc. (TJX) fell 4.2% to close at $62.50, after reporting its fourth-quarter fiscal 2022 results, which fell short of expectations. Despite delivering record U.S. open-only comparable sales growth, which surpassed pre-pandemic numbers by 13% in Q4 and 17% for FY22, the company’s numbers missed analysts' estimates on both the earnings and revenue front. TJX is one of America’s favorite off-price retailers of apparel and home furnishing hosting outlets including T.J. Maxx, Marshalls, HomeGoods, and Homesense across U.S. Canada, Europe and Australia. The company also intends to increase its quarterly common dividends by 13% to $0. |
What 6 Analyst Ratings Have To Say About TJX CompaniesOver the past 3 months, 6 analysts have published their opinion on TJX Companies (NYSE: TJX ) stock. These analysts are typically employed by large Wall Street banks and tasked with understanding a company''s business to predict how a stock will trade over the upcoming year. Bullish Somewhat Bullish Indifferent Somewhat Bearish Bearish Total Ratings 4 2 0 0 0 Last 30D 2 2 0 0 0 1M Ago 1 0 0 0 0 2M Ago 0 0 0 0 0 3M Ago 1 0 0 0 0 These 6 analysts have an average price target of $81.33 versus the current price of TJX Companies at $62.46, implying upside. Below is a summary of how these … Full story available on Benzinga.com |
10 Stocks in Focus After Posting Their Earnings ReportsIn this article, we will take a look at the 10 stocks in focus after posting their earnings reports. You can skip our detailed analysis of these companies and go directly to the 5 Stocks in Focus After Posting Their Earnings Reports. Recently, stocks from the consumer cyclical and healthcare sectors, including Lowe’s Companies, Inc. […] |
Company News for Feb 24, 2022Companies in The News Are: LOW,TJX,BCS,ETR |
TJX Price Returns
1-mo | -9.66% |
3-mo | -9.24% |
6-mo | -26.30% |
1-year | -16.54% |
3-year | 7.71% |
5-year | 67.83% |
YTD | -25.52% |
2021 | 12.83% |
2020 | 12.25% |
2019 | 38.76% |
2018 | 18.94% |
2017 | 3.46% |
TJX Dividends
Ex-Dividend Date | Type | Payout Amount | Change | ||||||
---|---|---|---|---|---|---|---|---|---|
Loading, please wait... |
Continue Researching TJX
Want to see what other sources are saying about Tjx Companies Inc's financials and stock price? Try the links below:Tjx Companies Inc (TJX) Stock Price | Nasdaq
Tjx Companies Inc (TJX) Stock Quote, History and News - Yahoo Finance
Tjx Companies Inc (TJX) Stock Price and Basic Information | MarketWatch
Loading social stream, please wait...