
Timken Company (The) (TKR): Price and Financial Metrics
TKR Price/Volume Stats
| Current price | $85.26 | 52-week high | $94.71 |
| Prev. close | $83.58 | 52-week low | $65.71 |
| Day low | $84.32 | Volume | 500,062 |
| Day high | $86.06 | Avg. volume | 475,288 |
| 50-day MA | $83.98 | Dividend yield | 1.63% |
| 200-day MA | $81.15 | Market Cap | 6.00B |
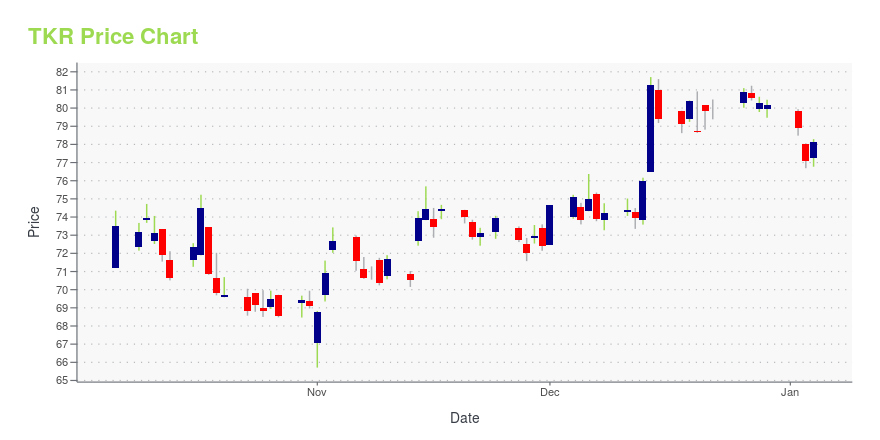
TKR Stock Price Chart Interactive Chart >
Timken Company (The) (TKR) Company Bio
Timken Company engineers, manufactures and markets bearings, transmissions, gearboxes, chain and related products, and offers a spectrum of powertrain rebuild and repair services. The company was founded in 1899 and is based in North Canton, Ohio.
Latest TKR News From Around the Web
Below are the latest news stories about TIMKEN CO that investors may wish to consider to help them evaluate TKR as an investment opportunity.
Here's Why We Think Timken (NYSE:TKR) Might Deserve Your Attention TodayFor beginners, it can seem like a good idea (and an exciting prospect) to buy a company that tells a good story to... |
Timken (TKR) Boosts Portfolio With Lagersmit AcquisitionTimken (TKR) acquires Lagersmit to add engineered sealing products to its portfolio. |
Timken Adds Engineered Sealing Solutions to Portfolio with Lagersmit AcquisitionThe Timken Company (NYSE: TKR; www.timken.com), a global leader in engineered bearings and industrial motion products, has acquired Lagersmit, a Netherlands-based manufacturer of highly engineered sealing solutions for demanding marine, dredging, water, tidal energy and other industrial applications. |
Century (CENX) Up 14% Since Last Earnings Report: Can It Continue?Century (CENX) reported earnings 30 days ago. What's next for the stock? We take a look at earnings estimates for some clues. |
Timken (NYSE:TKR) Shareholders Will Want The ROCE Trajectory To ContinueTo find a multi-bagger stock, what are the underlying trends we should look for in a business? Typically, we'll want to... |
TKR Price Returns
| 1-mo | 6.52% |
| 3-mo | 0.70% |
| 6-mo | 5.52% |
| 1-year | -4.33% |
| 3-year | 14.74% |
| 5-year | 94.86% |
| YTD | 7.21% |
| 2023 | 15.36% |
| 2022 | 3.91% |
| 2021 | -9.03% |
| 2020 | 40.35% |
| 2019 | 54.69% |
TKR Dividends
| Ex-Dividend Date | Type | Payout Amount | Change | ||||||
|---|---|---|---|---|---|---|---|---|---|
| Loading, please wait... | |||||||||
Continue Researching TKR
Want to see what other sources are saying about Timken Co's financials and stock price? Try the links below:Timken Co (TKR) Stock Price | Nasdaq
Timken Co (TKR) Stock Quote, History and News - Yahoo Finance
Timken Co (TKR) Stock Price and Basic Information | MarketWatch
Loading social stream, please wait...