
Tandy Leather Factory, Inc. (TLF): Price and Financial Metrics
TLF Price/Volume Stats
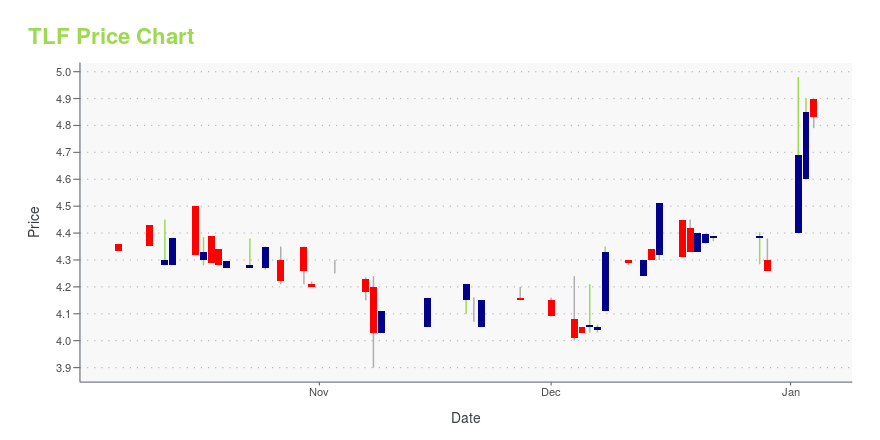
| Current price | $4.29 | 52-week high | $5.01 |
| Prev. close | $4.21 | 52-week low | $3.90 |
| Day low | $4.25 | Volume | 3,900 |
| Day high | $4.31 | Avg. volume | 4,299 |
| 50-day MA | $4.49 | Dividend yield | N/A |
| 200-day MA | $4.46 | Market Cap | 36.04M |
TLF Stock Price Chart Interactive Chart >
Latest TLF News From Around the Web
Below are the latest news stories about TANDY LEATHER FACTORY INC that investors may wish to consider to help them evaluate TLF as an investment opportunity.
Tandy Leather Factory Reports Third Quarter 2023 ResultsFORT WORTH, TEXAS, Nov. 08, 2023 (GLOBE NEWSWIRE) -- Tandy Leather Factory, Inc. (Nasdaq: TLF) today announced the Company’s financial results for the third fiscal quarter 2023, ended September 30, 2023. Third Quarter Highlights: Revenues were $17.5 million, down 8% from 2022Generated operating income of $0.9 millionNet income of $0.6 millionGross margins of 62.4%Adjusted EBITDA* of $1.4 millionEnded quarter with $8.6 million of cash and cash equivalents Tandy Leather Factory’s third quarter sal |
Tandy Leather Factory Second Quarter 2023 Earnings: EPS: US$0.064 (vs US$0.071 loss in 2Q 2022)Tandy Leather Factory ( NASDAQ:TLF ) Second Quarter 2023 Results Key Financial Results Revenue: US$17.5m (down 5.0... |
Tandy Leather Factory Reports Second Quarter 2023 ResultsFORT WORTH, Texas, Aug. 15, 2023 (GLOBE NEWSWIRE) -- Tandy Leather Factory, Inc. (Nasdaq: TLF) today announced the Company’s financial results for the second fiscal quarter 2023, ended June 30, 2023. Second Quarter Highlights: Revenues were $17.5 million, down 5% from 2022Generated operating income of $0.8 millionNet income of $0.5 millionGross margins of 62.5%Adjusted EBITDA* of $1.3 millionEnded quarter with $10.0 million of cash and cash equivalents Tandy Leather Factory’s second quarter sale |
Tandy Leather Factory Reports First Quarter 2023 ResultsFORT WORTH, Texas, May 16, 2023 (GLOBE NEWSWIRE) -- Tandy Leather Factory, Inc. (Nasdaq: TLF) today announced the Company’s financial results for the first fiscal quarter 2023, ended March 31, 2023. First Quarter Highlights: Revenues were $20.4 million, down 1% from 2022Generated operating income of $1.0 millionNet income of $0.7 millionGross margins of 58.1%Adjusted EBITDA* of $1.5 millionEnded quarter with $8.6 million of cash and cash equivalents Tandy Leather Factory’s first quarter sales we |
Tandy Leather Factory Reports Fourth Quarter and Full Year 2022 ResultsFORT WORTH, Texas, April 03, 2023 (GLOBE NEWSWIRE) -- On March 31, 2023, Tandy Leather Factory, Inc. (Nasdaq: TLF) announced the Company’s financial results for the fourth quarter and full year 2022. Highlights from 2022: Revenues were $80.3 million, down 3% from 2021Operating income of $1.4 millionNet income of $1.2 millionGross margins of 57.9%Adjusted EBITDA* of $4.0 millionRepurchased over 360,000 shares of common stock for a total of $1.8 millionEnded year with $8.0 million of cash and cash |
TLF Price Returns
| 1-mo | -2.94% |
| 3-mo | -13.33% |
| 6-mo | -3.38% |
| 1-year | 0.03% |
| 3-year | -10.63% |
| 5-year | -26.67% |
| YTD | 0.70% |
| 2023 | 0.24% |
| 2022 | -17.48% |
| 2021 | 60.94% |
| 2020 | -43.96% |
| 2019 | 0.53% |
Continue Researching TLF
Here are a few links from around the web to help you further your research on Tandy Leather Factory Inc's stock as an investment opportunity:Tandy Leather Factory Inc (TLF) Stock Price | Nasdaq
Tandy Leather Factory Inc (TLF) Stock Quote, History and News - Yahoo Finance
Tandy Leather Factory Inc (TLF) Stock Price and Basic Information | MarketWatch
Loading social stream, please wait...