
Toyota Motor Corp. ADR (TM): Price and Financial Metrics
TM Price/Volume Stats
| Current price | $192.52 | 52-week high | $255.23 |
| Prev. close | $195.25 | 52-week low | $160.38 |
| Day low | $190.51 | Volume | 317,171 |
| Day high | $192.84 | Avg. volume | 292,290 |
| 50-day MA | $206.24 | Dividend yield | 2.54% |
| 200-day MA | $208.64 | Market Cap | 259.40B |
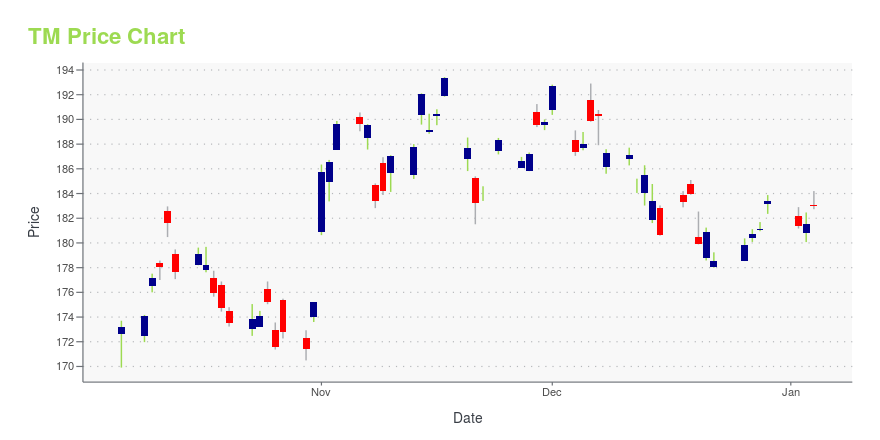
TM Stock Price Chart Interactive Chart >
Toyota Motor Corp. ADR (TM) Company Bio
Toyota Motor Corporation (Japanese: トヨタ自動車株式会社, Hepburn: Toyota Jidōsha kabushikigaisha, IPA: [toꜜjota], English: /tɔɪˈjoʊtə/, commonly known as simply Toyota) is a Japanese multinational automotive manufacturer headquartered in Toyota City, Aichi, Japan. It was founded by Kiichiro Toyoda and incorporated on August 28, 1937. Toyota is one of the largest automobile manufacturers in the world, producing about 10 million vehicles per year. (Source:Wikipedia)
Latest TM News From Around the Web
Below are the latest news stories about TOYOTA MOTOR CORP that investors may wish to consider to help them evaluate TM as an investment opportunity.
Cross-Border Champions: 3 Stocks Excelling in International MarketsWhile isolationism and nationalism appear to be rising themes in global politics, with the investing game, diversity is a core strength, thus boosting the narrative of international stocks. |
Tesla Forecast: Why 2024 Will Be Decisive for TSLA StockEntering 2024, TSLA stock ride the wave as the company chases global domination, but Elon Musk could be on the edge of total collapse. |
Better Dividend Stock: Ford or Toyota?These two auto companies offer above-average dividend yields. |
Better Dividend Stock: Ford or Toyota Motor Corporation?These two auto companies offer above-average dividend yields. |
Toyota (TM) Logs Record Sales & Production on High DemandIn November, Toyota's (TM) year-over-year global sales and production rose 12% and 11.2%, respectively. |
TM Price Returns
| 1-mo | -5.25% |
| 3-mo | -15.08% |
| 6-mo | -1.81% |
| 1-year | 18.71% |
| 3-year | 15.51% |
| 5-year | 65.03% |
| YTD | 6.05% |
| 2023 | 37.78% |
| 2022 | -24.64% |
| 2021 | 22.83% |
| 2020 | 13.22% |
| 2019 | 24.51% |
TM Dividends
| Ex-Dividend Date | Type | Payout Amount | Change | ||||||
|---|---|---|---|---|---|---|---|---|---|
| Loading, please wait... | |||||||||
Continue Researching TM
Here are a few links from around the web to help you further your research on Toyota Motor Corp's stock as an investment opportunity:Toyota Motor Corp (TM) Stock Price | Nasdaq
Toyota Motor Corp (TM) Stock Quote, History and News - Yahoo Finance
Toyota Motor Corp (TM) Stock Price and Basic Information | MarketWatch
Loading social stream, please wait...