T-Mobile US Inc. (TMUS): Price and Financial Metrics
TMUS Price/Volume Stats
Current price | $161.15 | 52-week high | $168.64 |
Prev. close | $161.81 | 52-week low | $124.92 |
Day low | $159.37 | Volume | 4,802,900 |
Day high | $162.02 | Avg. volume | 4,795,121 |
50-day MA | $163.03 | Dividend yield | 1.6% |
200-day MA | $147.36 | Market Cap | 191.26B |
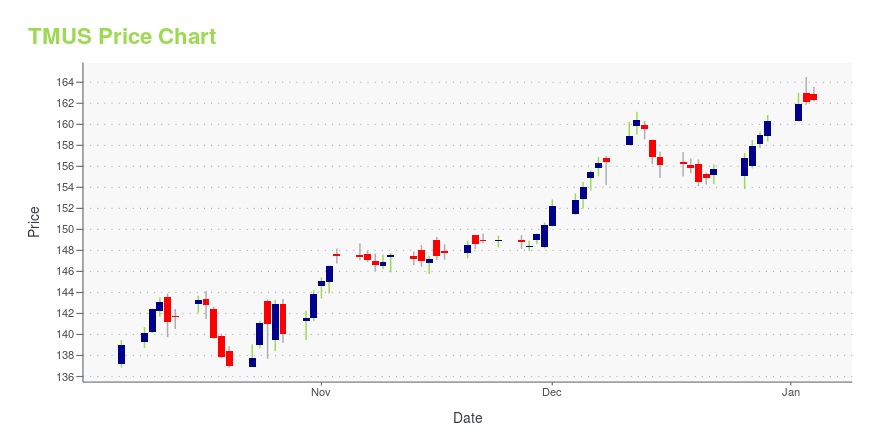
TMUS Stock Price Chart Interactive Chart >
TMUS POWR Grades
- Stability is the dimension where TMUS ranks best; there it ranks ahead of 91.54% of US stocks.
- TMUS's strongest trending metric is Growth; it's been moving down over the last 26 weeks.
- TMUS ranks lowest in Value; there it ranks in the 16th percentile.
TMUS Stock Summary
- TMUS has a higher market value than 98.96% of US stocks; more precisely, its current market capitalization is $187,441,477,725.
- In terms of twelve month growth in earnings before interest and taxes, T-MOBILE US INC is reporting a growth rate of 181.74%; that's higher than 93.59% of US stocks.
- In terms of volatility of its share price, TMUS is more volatile than merely 6.5% of stocks we're observing.
- If you're looking for stocks that are quantitatively similar to T-MOBILE US INC, a group of peers worth examining would be VZ, DIS, LIN, WFC, and UNP.
- Visit TMUS's SEC page to see the company's official filings. To visit the company's web site, go to www.t-mobile.com.
TMUS Valuation Summary
- In comparison to the median Communication Services stock, TMUS's price/earnings ratio is 33.71% higher, now standing at 23.8.
- Over the past 203 months, TMUS's price/sales ratio has gone down 0.4.
Below are key valuation metrics over time for TMUS.
Stock | Date | P/S | P/B | P/E | EV/EBIT |
---|---|---|---|---|---|
TMUS | 2023-12-29 | 2.4 | 2.9 | 23.8 | 21.4 |
TMUS | 2023-12-28 | 2.3 | 2.8 | 23.6 | 21.3 |
TMUS | 2023-12-27 | 2.3 | 2.8 | 23.5 | 21.2 |
TMUS | 2023-12-26 | 2.3 | 2.8 | 23.3 | 21.1 |
TMUS | 2023-12-22 | 2.3 | 2.8 | 23.1 | 21.0 |
TMUS | 2023-12-21 | 2.3 | 2.8 | 23.0 | 20.9 |
TMUS Growth Metrics
- Its 5 year revenue growth rate is now at 17.71%.
- The 2 year net cashflow from operations growth rate now stands at 100.04%.
- Its 5 year price growth rate is now at 31.34%.
The table below shows TMUS's growth in key financial areas (numbers in millions of US dollars).
Date | Revenue | Operating Cash Flow | Net Income to Common Stock |
---|---|---|---|
2022-12-31 | 79,571 | 16,781 | 2,590 |
2022-09-30 | 80,083 | 15,445 | 1,535 |
2022-06-30 | 80,230 | 14,531 | 1,718 |
2022-03-31 | 80,479 | 14,101 | 2,804 |
2021-12-31 | 80,118 | 13,917 | 3,024 |
2021-09-30 | 79,674 | 14,391 | 3,352 |
TMUS's Quality Factors
The “Quality” component of the POWR Ratings focuses on 31 different factors of a companies fundamentals and operational strength. Here are some key insights as we drill into the specifics of these quality attributes.- TMUS has a Quality Grade of D, ranking ahead of 21.4% of graded US stocks.
- TMUS's asset turnover comes in at 0.394 -- ranking 34th of 64 Communication stocks.
- VZ, CXDO, and USM are the stocks whose asset turnover ratios are most correlated with TMUS.
The table below shows TMUS's key quality metrics over time.
Period | Asset Turnover | Gross Margin | ROIC |
---|---|---|---|
2021-09-30 | 0.394 | 0.551 | 0.041 |
2021-06-30 | 0.397 | 0.561 | 0.046 |
2021-03-31 | 0.394 | 0.577 | 0.042 |
2020-12-31 | 0.410 | 0.587 | 0.047 |
2020-09-30 | 0.433 | 0.602 | 0.054 |
2020-06-30 | 0.462 | 0.602 | 0.057 |
TMUS Price Target
For more insight on analysts targets of TMUS, see our TMUS price target page. And for a list of of all stocks sorted by upside potential based on analyst target price, see our Top Price Target page.
Average Price Target | $148.75 | Average Broker Recommendation | 1.45 (Moderate Buy) |
T-Mobile US Inc. (TMUS) Company Bio
T-Mobile US, Inc., doing business under the global brand name T-Mobile, is an American wireless network operator. Its largest shareholder is German telecommunications company Deutsche Telekom (DT), which has a 43.2% share. Its headquarters are located in Bellevue, Washington, in the Seattle metropolitan area and Overland Park, Kansas, in the Kansas City metropolitan area. T-Mobile is the second-largest wireless carrier in the United States, with 104.8 million subscribers as of the end of Q2 2021. (Source:Wikipedia)
Latest TMUS News From Around the Web
Below are the latest news stories about T-MOBILE US INC that investors may wish to consider to help them evaluate TMUS as an investment opportunity.
The 3 Hottest 5G Stocks to Watch in 2024With the 5G services market set for unprecedented growth over the next decade, investors cannot ignore the three hottest 5G stocks for 2024. |
Apple’s Market Maneuvers: Is AAPL Stock a Smart Buy at $193?A ban on the Apple Watch could hit AAPL stock hard as the wearable is the tech stock's second biggest money-maker. |
3 Stocks Set for Success After Surviving Data Breaches in 2023While the share price of companies hit by a data breach often falls in the near term, the long-term doesn’t have to be fatal. |
The 5G Future: 3 Stocks Leading the Next Communication RevolutionCommunications is one of the most dynamic industries out there, get ahead of its advancements with these communication stocks. |
Stock Market Indexes Nudge Higher; Tesla Steers Into Buy ZoneAfter starting to venture higher in morning trades, major stock market indexes were mixed after the release of Fed factory data. |
TMUS Price Returns
1-mo | 0.86% |
3-mo | 4.69% |
6-mo | 16.08% |
1-year | 11.60% |
3-year | 30.85% |
5-year | 124.88% |
YTD | 0.91% |
2023 | 15.02% |
2022 | 20.71% |
2021 | -13.99% |
2020 | 71.96% |
2019 | 23.28% |
TMUS Dividends
Ex-Dividend Date | Type | Payout Amount | Change | ||||||
---|---|---|---|---|---|---|---|---|---|
Loading, please wait... |
Continue Researching TMUS
Want to do more research on T-Mobile US Inc's stock and its price? Try the links below:T-Mobile US Inc (TMUS) Stock Price | Nasdaq
T-Mobile US Inc (TMUS) Stock Quote, History and News - Yahoo Finance
T-Mobile US Inc (TMUS) Stock Price and Basic Information | MarketWatch
Loading social stream, please wait...