T-Mobile US Inc. (TMUS): Price and Financial Metrics
TMUS Price/Volume Stats
Current price | $126.55 | 52-week high | $154.38 |
Prev. close | $128.54 | 52-week low | $121.76 |
Day low | $126.05 | Volume | 11,273,600 |
Day high | $129.00 | Avg. volume | 5,942,860 |
50-day MA | $142.98 | Dividend yield | N/A |
200-day MA | $143.45 | Market Cap | 151.85B |
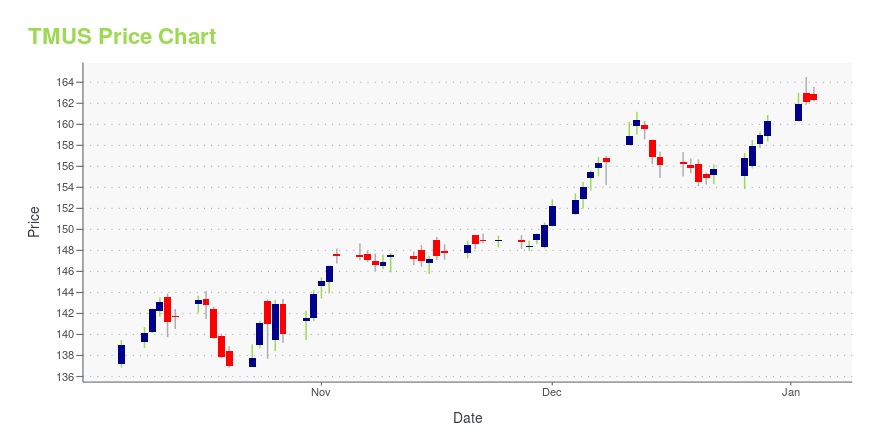
TMUS Stock Price Chart Interactive Chart >
TMUS POWR Grades
- Stability is the dimension where TMUS ranks best; there it ranks ahead of 90.57% of US stocks.
- TMUS's strongest trending metric is Stability; it's been moving up over the last 179 days.
- TMUS's current lowest rank is in the Momentum metric (where it is better than 7.61% of US stocks).
TMUS Stock Summary
- TMUS has a higher market value than 99.03% of US stocks; more precisely, its current market capitalization is $167,984,945,100.
- TMUS's one year PEG ratio, measuring expected growth in earnings next year relative to current common stock price is 175.26 -- higher than 86.27% of US-listed equities with positive expected earnings growth.
- The volatility of T-MOBILE US INC's share price is greater than that of merely 0.22% US stocks with at least 200 days of trading history.
- Stocks with similar financial metrics, market capitalization, and price volatility to T-MOBILE US INC are CMCSA, DIS, VZ, LIN, and WFC.
- TMUS's SEC filings can be seen here. And to visit T-MOBILE US INC's official web site, go to www.t-mobile.com.
TMUS Valuation Summary
- TMUS's EV/EBIT ratio is 33.5; this is 52.97% higher than that of the median Communication Services stock.
- Over the past 196 months, TMUS's EV/EBIT ratio has gone up 0.9.
Below are key valuation metrics over time for TMUS.
Stock | Date | P/S | P/B | P/E | EV/EBIT |
---|---|---|---|---|---|
TMUS | 2023-05-19 | 2.1 | 2.5 | 43.7 | 33.5 |
TMUS | 2023-05-18 | 2.1 | 2.5 | 43.4 | 33.4 |
TMUS | 2023-05-17 | 2.1 | 2.5 | 44.5 | 33.9 |
TMUS | 2023-05-16 | 2.2 | 2.6 | 45.2 | 34.2 |
TMUS | 2023-05-15 | 2.2 | 2.6 | 45.5 | 34.4 |
TMUS | 2023-05-12 | 2.2 | 2.6 | 45.3 | 34.3 |
TMUS Growth Metrics
- Its 5 year revenue growth rate is now at 17.71%.
- The 2 year net cashflow from operations growth rate now stands at 100.04%.
- Its 5 year price growth rate is now at 31.34%.

The table below shows TMUS's growth in key financial areas (numbers in millions of US dollars).
Date | Revenue | Operating Cash Flow | Net Income to Common Stock |
---|---|---|---|
2022-12-31 | 79,571 | 16,781 | 2,590 |
2022-09-30 | 80,083 | 15,445 | 1,535 |
2022-06-30 | 80,230 | 14,531 | 1,718 |
2022-03-31 | 80,479 | 14,101 | 2,804 |
2021-12-31 | 80,118 | 13,917 | 3,024 |
2021-09-30 | 79,674 | 14,391 | 3,352 |
TMUS's Quality Factors
The “Quality” component of the POWR Ratings focuses on 31 different factors of a companies fundamentals and operational strength. Here are some key insights as we drill into the specifics of these quality attributes.- TMUS has a Quality Grade of D, ranking ahead of 21.4% of graded US stocks.
- TMUS's asset turnover comes in at 0.394 -- ranking 34th of 64 Communication stocks.
- VZ, CXDO, and USM are the stocks whose asset turnover ratios are most correlated with TMUS.
The table below shows TMUS's key quality metrics over time.
Period | Asset Turnover | Gross Margin | ROIC |
---|---|---|---|
2021-09-30 | 0.394 | 0.551 | 0.041 |
2021-06-30 | 0.397 | 0.561 | 0.046 |
2021-03-31 | 0.394 | 0.577 | 0.042 |
2020-12-31 | 0.410 | 0.587 | 0.047 |
2020-09-30 | 0.433 | 0.602 | 0.054 |
2020-06-30 | 0.462 | 0.602 | 0.057 |
TMUS Price Target
For more insight on analysts targets of TMUS, see our TMUS price target page. And for a list of of all stocks sorted by upside potential based on analyst target price, see our Top Price Target page.
Average Price Target | $148.75 | Average Broker Recommendation | 1.45 (Moderate Buy) |
T-Mobile US Inc. (TMUS) Company Bio
T-Mobile US, Inc., doing business under the global brand name T-Mobile, is an American wireless network operator. Its largest shareholder is German telecommunications company Deutsche Telekom (DT), which has a 43.2% share. Its headquarters are located in Bellevue, Washington, in the Seattle metropolitan area and Overland Park, Kansas, in the Kansas City metropolitan area. T-Mobile is the second-largest wireless carrier in the United States, with 104.8 million subscribers as of the end of Q2 2021. (Source:Wikipedia)
Latest TMUS News From Around the Web
Below are the latest news stories about T-MOBILE US INC that investors may wish to consider to help them evaluate TMUS as an investment opportunity.
T-Mobile CEO Mike Sievert’s Commencement 2023 Advice: Follow Your Competence, Don’t Worry About It … And Take the MintNORTHAMPTON, MA / ACCESSWIRE / June 6, 2023 / T-Mobile: By Mike Sievert, CEO of T-Mobile I was honored to deliver a commencement speech June 4 at the University of Washington's Foster School of Business undergraduate graduation ceremony. What ... |
T-Mobile's (TMUS) 5G Service Powers BVLOS Drone InspectionValmont has leveraged T-Mobile's (TMUS) robust and dependable 5G technology to complete a 77-mile unmanned industry-first beyond visual line of sight (BVLOS) drone inspection operation. |
HOPE Hydration Taps T-Mobile to Power "Smart" Water Refill StationsBELLEVUE, Wash. & MIAMI, June 06, 2023--T-Mobile (NASDAQ: TMUS): |
10 5G Stocks Billionaires Are Loading Up OnIn this article, we discuss 10 5G stocks billionaires are loading up on. If you want to see more stocks in this selection, check out 5 5G Stocks Billionaires Are Loading Up On. The global market for 5G technologies is projected to experience substantial growth, with an expected increase from $30.62 billion in 2022 to […] |
Your Amazon Prime Could Cut Your Phone Bill to $10 or LessIf you thought Amazon couldn't cast its net even wider, you're mistaken. The e-commerce giant is reportedly considering a move into mobile phone service that could cut monthly phone bills to less than... |
TMUS Price Returns
1-mo | -10.90% |
3-mo | -9.29% |
6-mo | -10.61% |
1-year | -6.40% |
3-year | 21.15% |
5-year | 118.94% |
YTD | -9.61% |
2022 | 20.71% |
2021 | -13.99% |
2020 | 71.96% |
2019 | 23.28% |
2018 | 0.16% |
Continue Researching TMUS
Want to do more research on T-Mobile US Inc's stock and its price? Try the links below:T-Mobile US Inc (TMUS) Stock Price | Nasdaq
T-Mobile US Inc (TMUS) Stock Quote, History and News - Yahoo Finance
T-Mobile US Inc (TMUS) Stock Price and Basic Information | MarketWatch
Loading social stream, please wait...