Tandem Diabetes Care, Inc. (TNDM): Price and Financial Metrics

Tandem Diabetes Care, Inc. (TNDM): $21.25

0.03 (+0.14%)

POWR Rating

Component Grades

Momentum

F

Stability

D

Sentiment

Quality

C

TNDM Price/Volume Stats

Current price $21.25 52-week high $47.17
Prev. close $21.22 52-week low $13.82
Day low $20.85 Volume 123,791
Day high $21.47 Avg. volume 1,374,058
50-day MA $18.51 Dividend yield N/A
200-day MA $28.65 Market Cap 1.39B

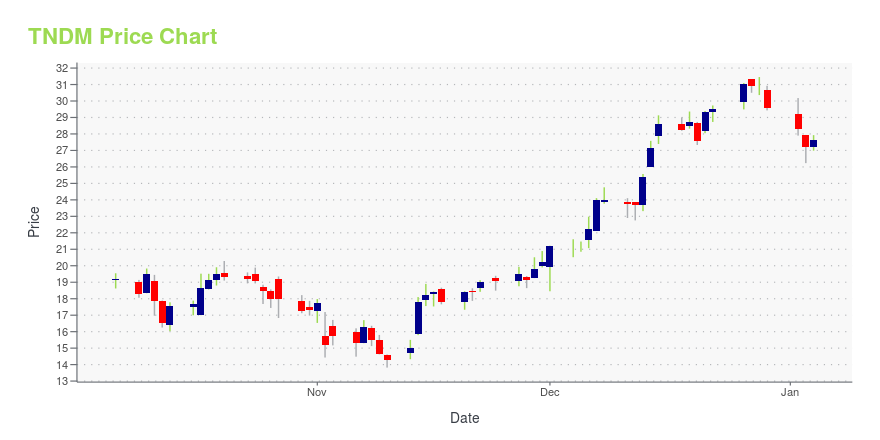
TNDM Stock Price Chart Interactive Chart >

TNDM POWR Grades

  • TNDM scores best on the Value dimension, with a Value rank ahead of 82.1% of US stocks.
  • TNDM's strongest trending metric is Growth; it's been moving up over the last 177 days.
  • TNDM's current lowest rank is in the Momentum metric (where it is better than 1.44% of US stocks).

TNDM Stock Summary

  • TANDEM DIABETES CARE INC's capital turnover -- a measure of revenue relative to shareholder's equity -- is better than 77.53% of US listed stocks.
  • In terms of twelve month growth in earnings before interest and taxes, TANDEM DIABETES CARE INC is reporting a growth rate of 228.68%; that's higher than 94.48% of US stocks.
  • The volatility of TANDEM DIABETES CARE INC's share price is greater than that of 84.66% US stocks with at least 200 days of trading history.
  • Stocks with similar financial metrics, market capitalization, and price volatility to TANDEM DIABETES CARE INC are PHR, NTCT, MXCT, HCAT, and CMTL.
  • TNDM's SEC filings can be seen here. And to visit TANDEM DIABETES CARE INC's official web site, go to www.tandemdiabetes.com.

TNDM Valuation Summary

  • TNDM's EV/EBIT ratio is -7.9; this is 162.2% lower than that of the median Healthcare stock.
  • TNDM's price/sales ratio has moved down 18.8 over the prior 120 months.

Below are key valuation metrics over time for TNDM.

Stock Date P/S P/B P/E EV/EBIT
TNDM 2023-11-20 1.6 3.8 -5.8 -7.9
TNDM 2023-11-17 1.5 3.7 -5.6 -7.7
TNDM 2023-11-16 1.6 3.8 -5.8 -7.9
TNDM 2023-11-15 1.5 3.8 -5.7 -7.8
TNDM 2023-11-14 1.5 3.7 -5.6 -7.7
TNDM 2023-11-13 1.3 3.1 -4.7 -6.7

TNDM Growth Metrics

    The 4 year revenue growth rate now stands at 374.03%.
  • The 2 year price growth rate now stands at 18.36%.
  • Its 2 year net income to common stockholders growth rate is now at 135.45%.
Over the past 52 months, TNDM's revenue has gone up $653,255,000.

The table below shows TNDM's growth in key financial areas (numbers in millions of US dollars).

Date Revenue Operating Cash Flow Net Income to Common Stock
2022-12-31 801.217 50.464 -94.594
2022-09-30 790.712 64.279 -67.933
2022-06-30 765.792 74.48 -13.169
2022-03-31 737.669 96.474 5.895
2021-12-31 702.799 111.359 15.566
2021-09-30 660.868 106.961 21.758

TNDM's Quality Factors

The “Quality” component of the POWR Ratings focuses on 31 different factors of a companies fundamentals and operational strength. Here are some key insights as we drill into the specifics of these quality attributes.
  • TNDM has a Quality Grade of C, ranking ahead of 66.11% of graded US stocks.
  • TNDM's asset turnover comes in at 0.848 -- ranking 30th of 186 Medical Equipment stocks.
  • IVC, TCMD, and PSTV are the stocks whose asset turnover ratios are most correlated with TNDM.

The table below shows TNDM's key quality metrics over time.

Period Asset Turnover Gross Margin ROIC
2021-09-30 0.848 0.534 0.036
2021-06-30 0.823 0.532 0.024
2021-03-31 0.785 0.523 -0.018
2020-12-31 0.849 0.522 -0.045
2020-09-30 0.897 0.524 -0.109
2020-06-30 1.040 0.526 -0.154

TNDM Price Target

For more insight on analysts targets of TNDM, see our TNDM price target page. And for a list of of all stocks sorted by upside potential based on analyst target price, see our Top Price Target page.

Average Price Target $132.75 Average Broker Recommendation 1.62 (Moderate Buy)

Tandem Diabetes Care, Inc. (TNDM) Company Bio


Tandem Diabetes Care, Inc. focuses on the design, development, and commercialization of various products for people with insulin-dependent diabetes in the United States. The company was formerly known as Phluid Inc. and changed its name to Tandem Diabetes Care, Inc. in January 2008. The company was founded in 2006 and is based in San Diego, California.


TNDM Latest News Stream


Event/Time News Detail
Loading, please wait...

TNDM Latest Social Stream


Loading social stream, please wait...

View Full TNDM Social Stream

Latest TNDM News From Around the Web

Below are the latest news stories about TANDEM DIABETES CARE INC that investors may wish to consider to help them evaluate TNDM as an investment opportunity.

Is Tandem Diabetes Care, Inc. (NASDAQ:TNDM) Potentially Undervalued?

Tandem Diabetes Care, Inc. ( NASDAQ:TNDM ), might not be a large cap stock, but it received a lot of attention from a...

Yahoo | December 4, 2023

Why Is Tandem Diabetes Care, Inc. (TNDM) Up 33.2% Since Last Earnings Report?

Tandem Diabetes Care, Inc. (TNDM) reported earnings 30 days ago. What's next for the stock? We take a look at earnings estimates for some clues.

Yahoo | December 1, 2023

Unomedical recall of infusion sets tagged as Class I by FDA

The company notified Tandem Diabetes Care, its sole consignee, in October of the risk for infusion sets to detach from insulin pumps, disrupting insulin delivery.

Yahoo | November 28, 2023

12 Best Diabetes Stocks To Buy Now

In this article, we shall discuss the 12 best diabetes stocks to buy now. To skip our detailed analysis of the global diabetes drugs industry in 2023, go directly and see 5 Best Diabetes Stocks to Buy Now. Diabetes is a chronic metabolic disease which is normally characterized by high blood glucose levels, which tend […]

Yahoo | November 26, 2023

15 Stocks with Consistent Growth

In this article, we will take a look at the 15 stocks with consistent growth. To skip our analysis of recent market trends, you can go directly to 5 Stocks with Consistent Growth. Growth companies and companies working on disruptive technologies were hit hardest by the market conditions as the cost of capital rose significantly […]

Yahoo | November 23, 2023

Read More 'TNDM' Stories Here

TNDM Price Returns

1-mo 34.92%
3-mo -24.51%
6-mo -12.12%
1-year -49.93%
3-year -77.55%
5-year -39.49%
YTD -52.73%
2022 -70.14%
2021 57.32%
2020 60.51%
2019 56.99%
2018 1,508.90%

Continue Researching TNDM

Here are a few links from around the web to help you further your research on Tandem Diabetes Care Inc's stock as an investment opportunity:

Tandem Diabetes Care Inc (TNDM) Stock Price | Nasdaq
Tandem Diabetes Care Inc (TNDM) Stock Quote, History and News - Yahoo Finance
Tandem Diabetes Care Inc (TNDM) Stock Price and Basic Information | MarketWatch

Get Free Updates

Join thousands of investors who get the latest news, insights and top rated picks from StockNews.com!