
Tenon Medical, Inc. (TNON): Price and Financial Metrics
TNON Price/Volume Stats
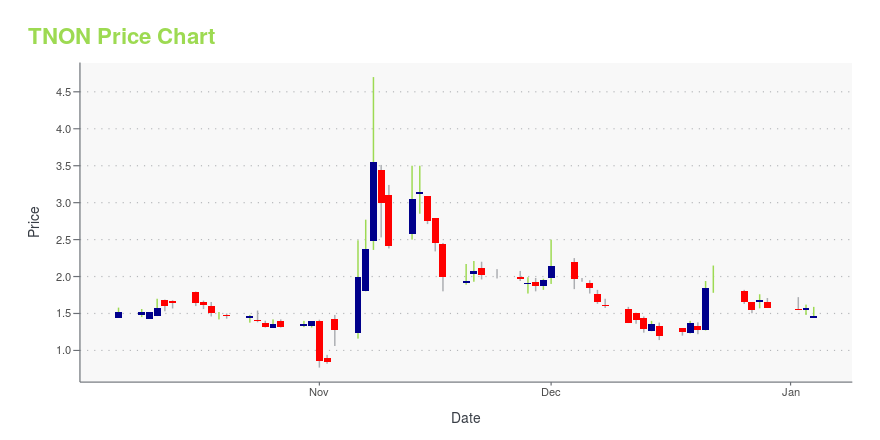
| Current price | $0.64 | 52-week high | $4.70 |
| Prev. close | $0.62 | 52-week low | $0.55 |
| Day low | $0.59 | Volume | 48,965 |
| Day high | $0.65 | Avg. volume | 129,769 |
| 50-day MA | $0.69 | Dividend yield | N/A |
| 200-day MA | $1.19 | Market Cap | 2.41M |
TNON Stock Price Chart Interactive Chart >
Tenon Medical, Inc. (TNON) Company Bio
Tenon Medical, Inc., a medical device company, develops surgical implant systems to optimize sacroiliac joint fixation/fusion surgery and corresponding outcomes. It sells The CATAMARAN SIJ Fusion System that includes instruments and implants designed to prepare and fixate the SI-Joint for fusion in the United States and Puerto Rico. The company was founded in 2012 and is based in Los Gatos, California.
Latest TNON News From Around the Web
Below are the latest news stories about TENON MEDICAL INC that investors may wish to consider to help them evaluate TNON as an investment opportunity.
Tenon Medical, Inc. Announces Adjournment of Special Meeting of StockholdersMeeting adjourned to Monday, January 8, 2024 at 1:30pm Pacific Time LOS GATOS, CA / ACCESSWIRE / December 22, 2023 / Tenon Medical, Inc. ("Tenon" or the "Company") (NASDAQ:TNON), a company transforming care for patients suffering with certain sacroiliac ... |
Tenon Medical Announces Participation in Two Key Immersive Webinar Physician Training Programs Featuring the Company’s Catamaran(R) SI Joint Fusion System~ Training Programs Led by Dr. Matthew Davies from Duluth, MN and Included Simulated Catamaran Procedure ~ ~ Reached Approximately 60 Health Care Providers Between the Two Catamaran Training Sessions ~ LOS GATOS, CA / ACCESSWIRE / December 20, 2023 ... |
Tenon Medical Announces Closing of $1.25 Million Secured Note Financing~ Provides Additional Liquidity to Augment Commercialization of Tenon's SI Joint Fusion Devices ~LOS GATOS, CA / ACCESSWIRE / November 21, 2023 / Tenon Medical, Inc. ("Tenon" or the "Company") (NASDAQ:TNON), a company transforming care for patients ... |
Tenon Medical Reports Third Quarter 2023 Financial Results~ Revenue Increased 354% Year-Over-Year to $944,000 ~~ Gross Profit Margin of 57% an Increase of 31 Basis Points Sequentially ~~ Surgical Procedures Increased 329% in the Third Quarter ~~ Concluded the Quarter with the Surgical Launch of the JIB Instrument ... |
Tenon Medical Passes FDA Level 2 Inspection~ No Observations, No Objectionable Conditions and No Form 483 Issued ~LOS GATOS, CA / ACCESSWIRE / November 3, 2023 / Tenon Medical, Inc. ("Tenon" or the "Company") (NASDAQ:TNON), a company transforming care for patients suffering with certain sacroiliac ... |
TNON Price Returns
| 1-mo | 4.92% |
| 3-mo | -14.85% |
| 6-mo | -49.53% |
| 1-year | -77.30% |
| 3-year | N/A |
| 5-year | N/A |
| YTD | -59.49% |
| 2023 | -90.00% |
| 2022 | N/A |
| 2021 | N/A |
| 2020 | N/A |
| 2019 | N/A |
Loading social stream, please wait...