
TOMI Environmental Solutions Inc. (TOMZ): Price and Financial Metrics
TOMZ Price/Volume Stats
| Current price | $0.76 | 52-week high | $1.39 |
| Prev. close | $0.73 | 52-week low | $0.52 |
| Day low | $0.73 | Volume | 20,402 |
| Day high | $0.77 | Avg. volume | 44,748 |
| 50-day MA | $0.84 | Dividend yield | N/A |
| 200-day MA | $0.83 | Market Cap | 15.16M |
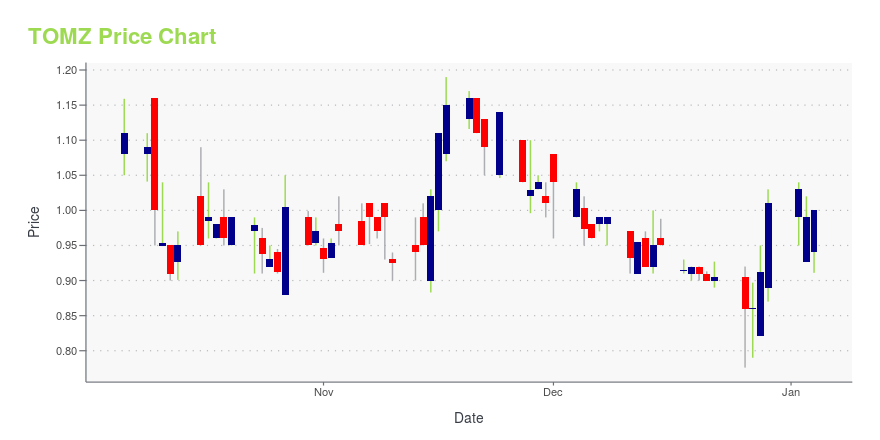
TOMZ Stock Price Chart Interactive Chart >
TOMI Environmental Solutions Inc. (TOMZ) Company Bio
TOMI Environmental Solutions Inc. offers bacteria decontamination and infectious disease control products. The Company provides green energy efficient environmental solutions for indoor surface contamination through the manufacturing, servicing, selling and licensing of its products. TOMI offers products to customers including hospitals, schools, restaurants and hotels.
Latest TOMZ News From Around the Web
Below are the latest news stories about TOMI ENVIRONMENTAL SOLUTIONS INC that investors may wish to consider to help them evaluate TOMZ as an investment opportunity.
SteraMist Welcomes Sterile Grow as U.S. Distributor for Food Safety and Cannabis-Partnership Expands TOMI’s Market in Food, Agriculture, and Cannabis Industries -FREDERICK, Md., Nov. 27, 2023 (GLOBE NEWSWIRE) -- TOMI Environmental Solutions, Inc.® (“TOMI”) (NASDAQ: TOMZ), a global company specializing in disinfection and decontamination solutions, is proud to announce the addition of Sterile Grow, a United States based distributor and consultation company in the food and cannabis market. SteraMist is pleased to collaborate with Sterile Grow, led by Burrell Williamson III an |
TOMI Environmental Solutions, Inc. (NASDAQ:TOMZ) Q3 2023 Earnings Call TranscriptTOMI Environmental Solutions, Inc. (NASDAQ:TOMZ) Q3 2023 Earnings Call Transcript November 14, 2023 Operator: Greetings. Welcome to the TOMI Environmental Solutions, Inc. Third Quarter 2023 Financial Results Conference Call. [Operator Instructions] Please note that this conference is being recorded. I will now turn the conference over to your host, John Nesbett of IMS Investor Relations. […] |
Tomi Environmental Solutions, Inc. Reports Third Quarter Financial ResultsFREDERICK, Md., Nov. 14, 2023 (GLOBE NEWSWIRE) -- TOMI Environmental Solutions, Inc.® (“TOMI”) (NASDAQ: TOMZ), a global company specializing in disinfection and decontamination utilizing its premier Binary Ionization Technology (BIT) platform through its SteraMist brand of products, today announced its financial results for the third quarter of 2023. TOMI Chief Executive Officer, Dr. Halden Shane, stated, “During the third quarter of 2023, we continued to expand our sales channels and business d |
TOMI Environmental Solutions, Inc. to Hold Conference Call to Discuss Third Quarter 2023 Financial Results on November 14, 2023FREDERICK, Md., Nov. 08, 2023 (GLOBE NEWSWIRE) -- TOMI Environmental Solutions, Inc.® (“TOMI”) (NASDAQ: TOMZ), a global company specializing in disinfection and decontamination solutions, today announced it will report results for the third quarter ended September 30, 2023, after the close of the financial markets on Tuesday, November 14, 2023, and will hold a conference call at 4:30 p.m. ET that day. To participate in the call by phone, dial (877) 545-0523 approximately five minutes prior to th |
TOMI Rolls Out New Innovative Disinfection Products to Support Its Expanding Customer BaseFREDERICK, Md., Sept. 29, 2023 (GLOBE NEWSWIRE) -- TOMI Environmental Solutions, Inc.® (“TOMI”) (NASDAQ: TOMZ), a global company specializing in disinfection and decontamination solutions, is rolling out two new products, the SteraMist Hybrid and SteraMist Transport, to support its ongoing commitment to providing superior disinfection decontamination solutions for its growing customer base. SteraMist Hybrid An integral component of the SteraMist Environment System, SteraMist Hybrid is designed w |
TOMZ Price Returns
| 1-mo | -24.00% |
| 3-mo | 25.52% |
| 6-mo | -9.28% |
| 1-year | 1.20% |
| 3-year | -70.20% |
| 5-year | -10.38% |
| YTD | -24.75% |
| 2023 | 105.28% |
| 2022 | -70.18% |
| 2021 | -63.89% |
| 2020 | 406.43% |
| 2019 | -1.91% |
Loading social stream, please wait...