
Trio Petroleum Corp. (TPET): Price and Financial Metrics
TPET Price/Volume Stats
| Current price | $0.26 | 52-week high | $0.97 |
| Prev. close | $0.25 | 52-week low | $0.08 |
| Day low | $0.25 | Volume | 589,093 |
| Day high | $0.26 | Avg. volume | 12,272,883 |
| 50-day MA | $0.27 | Dividend yield | N/A |
| 200-day MA | $0.27 | Market Cap | 12.89M |
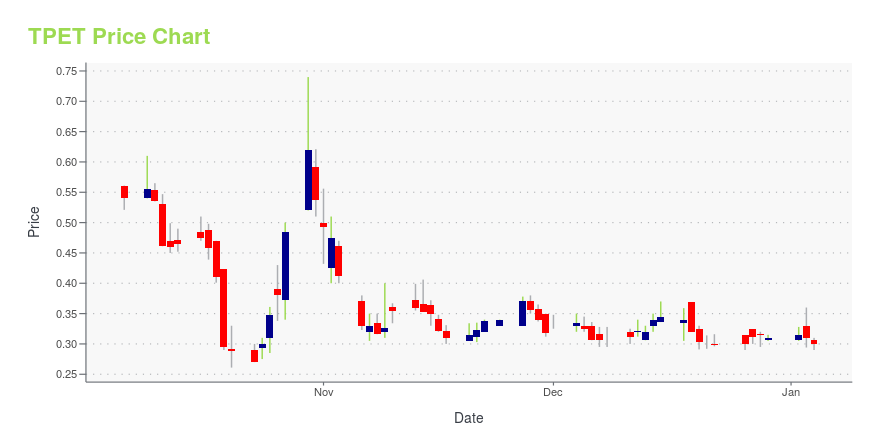
TPET Stock Price Chart Interactive Chart >
Latest TPET News From Around the Web
Below are the latest news stories about TRIO PETROLEUM CORP that investors may wish to consider to help them evaluate TPET as an investment opportunity.
Trio Petroleum Corp Announces an Option to Acquire a 40 BCF Potential Natural Gas Prospect in the Sacramento Basin, CaliforniaBAKERSFIELD, CA, Oct. 23, 2023 (GLOBE NEWSWIRE) -- Trio Petroleum Corp. (NYSE American: TPET) (“Trio” or the “Company”), a California-based oil and gas company, today announced that it has secured a four-month option (the “Option”) with exclusivity to acquire a natural gas prospect in the Sacramento Basin with potential to produce an estimated 40 billion cubic feet of gas (BCF). The prospect is close to prolific gas fields, has easy access to a gas pipeline with excess capacity and targets gas s |
Trio Petroleum Corp Announces Acquisition of a 22% Interest in the McCool Ranch Oil FieldFully Permitted to Restart Production from Six Previously Producing Wells BAKERSFIELD, CA, Oct. 18, 2023 (GLOBE NEWSWIRE) -- Trio Petroleum Corp (NYSE American: TPET) (“Trio” or the “Company”), a California-based oil and gas company, today announced that it has acquired an approximate 22% working interest in the McCool Ranch Oil Field (“McCool Ranch”). McCool Ranch is located in Monterey County seven miles north of the Company’s flagship South Salinas Project. The Company is acquiring McCool Ran |
Trio Petroleum Corp Announces Appointment of Michael L. Peterson as CEOFrank Ingriselli to Assume Role of Vice Chairman BAKERSFIELD, CA, Oct. 18, 2023 (GLOBE NEWSWIRE) -- Trio Petroleum Corp (NYSE American: TPET) (“Trio” or the “Company”), a California-based oil and gas company, today announced that Michael L. Peterson has been appointed as the new CEO of Trio effective October 23, 2023, replacing Frank C. Ingriselli who will be resigning, effective as of the same date. Mr. Peterson is currently a member of the Company’s Board of Directors, serving as the Chairman |
Trio Petroleum Corp LD Micro Presentation Replay Now AvailableIncludes Update on HV-1 Discovery Well Operations and Testing DANVILLE, CA, Oct. 12, 2023 (GLOBE NEWSWIRE) -- Trio Petroleum Corp (NYSE American: TPET) (“Trio” or the “Company”), a California-based oil and gas company, today announced that a replay of its October 3rd presentation and Q&A session at the LD Micro Main Event Investor Conference is now available. To view the replay directly, please click the following link: LD Micro Main Event XVI 2023 Events. The presentation took place on Tuesday, |
Trio Petroleum Corp To Present at LD Micro XVI Main Event Investor Conference on Tuesday, October 3rd at 3:00pm PTWill Provide Update on Operations and Testing of HV-1 Discovery Well DANVILLE, CA, Sept. 27, 2023 (GLOBE NEWSWIRE) -- Trio Petroleum Corp (NYSE American: TPET) (“Trio” or the “Company”), a California-based oil and gas company, today announced its President, Frank Ingriselli and its Director, Michael L. Peterson, will be presenting at the LD Micro XVI Main Event investor conference on Tuesday, October 3rd at 3:00pm PT. The event will be held in-person at the Luxe Sunset Boulevard Hotel in Los Ang |
TPET Price Returns
| 1-mo | -6.74% |
| 3-mo | -29.39% |
| 6-mo | 36.13% |
| 1-year | -68.67% |
| 3-year | N/A |
| 5-year | N/A |
| YTD | -16.10% |
| 2023 | N/A |
| 2022 | N/A |
| 2021 | N/A |
| 2020 | N/A |
| 2019 | N/A |
Loading social stream, please wait...