TPG Inc. (TPG): Price and Financial Metrics
TPG Price/Volume Stats
| Current price | $51.91 | 52-week high | $72.98 |
| Prev. close | $51.29 | 52-week low | $37.52 |
| Day low | $51.06 | Volume | 934,600 |
| Day high | $52.11 | Avg. volume | 1,502,117 |
| 50-day MA | $47.35 | Dividend yield | 4.01% |
| 200-day MA | $57.15 | Market Cap | 19.18B |
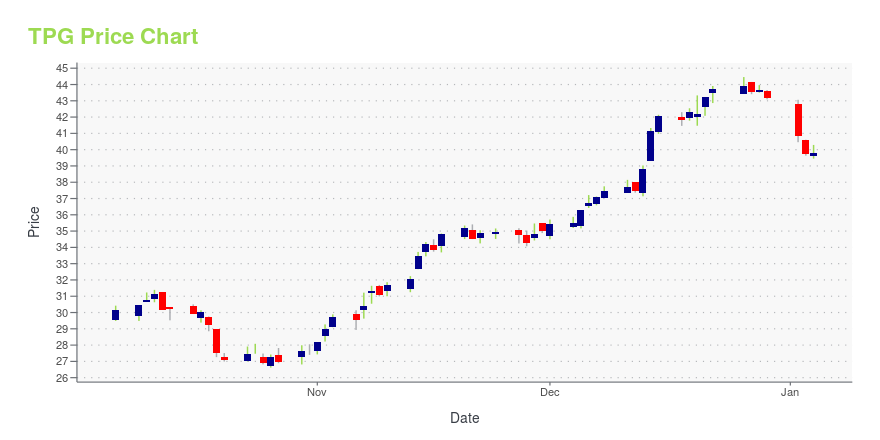
TPG Stock Price Chart Interactive Chart >
TPG Inc. (TPG) Company Bio
TPG Inc. operates as an alternative asset manager worldwide. It offers investment management services to unconsolidated funds, collateralized loan obligations, and other vehicles; monitoring services to portfolio companies; advisory services, debt and equity arrangements, and underwriting and placement services; and capital structuring and other advisory services to portfolio companies. The company invests in private equity funds, real estate funds, fund of hedge funds, and credit funds. TPG Inc. was founded in 1992 and is based in Fort Worth, Texas.
TPG Price Returns
| 1-mo | 19.31% |
| 3-mo | -11.78% |
| 6-mo | -21.14% |
| 1-year | 23.90% |
| 3-year | 116.07% |
| 5-year | N/A |
| YTD | -16.64% |
| 2024 | 50.60% |
| 2023 | 62.37% |
| 2022 | N/A |
| 2021 | N/A |
| 2020 | N/A |
TPG Dividends
| Ex-Dividend Date | Type | Payout Amount | Change | ||||||
|---|---|---|---|---|---|---|---|---|---|
| Loading, please wait... | |||||||||


Loading social stream, please wait...