TRI Pointe Group, Inc. (TPH): Price and Financial Metrics
TPH Price/Volume Stats
Current price | $37.93 | 52-week high | $37.94 |
Prev. close | $36.80 | 52-week low | $24.18 |
Day low | $37.13 | Volume | 1,123,000 |
Day high | $37.94 | Avg. volume | 1,098,628 |
50-day MA | $35.07 | Dividend yield | N/A |
200-day MA | $31.57 | Market Cap | 3.62B |
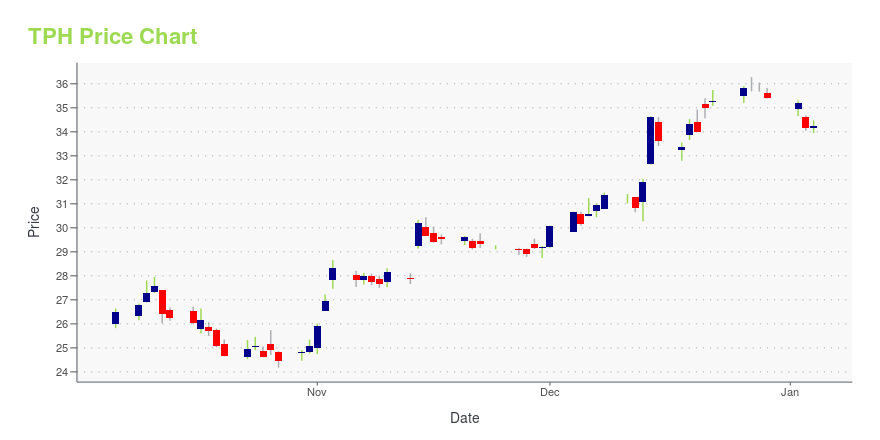
TPH Stock Price Chart Interactive Chart >
TPH POWR Grades
- TPH scores best on the Momentum dimension, with a Momentum rank ahead of 99.98% of US stocks.
- TPH's strongest trending metric is Quality; it's been moving down over the last 26 weeks.
- TPH's current lowest rank is in the Growth metric (where it is better than 6.64% of US stocks).
TPH Stock Summary
- With a price/earnings ratio of 8.01, TRI POINTE HOMES INC P/E ratio is greater than that of about only 13.84% of stocks in our set with positive earnings.
- The price/operating cash flow metric for TRI POINTE HOMES INC is higher than only 17.16% of stocks in our set with a positive cash flow.
- Of note is the ratio of TRI POINTE HOMES INC's sales and general administrative expense to its total operating expenses; 76.86% of US stocks have a lower such ratio.
- Stocks with similar financial metrics, market capitalization, and price volatility to TRI POINTE HOMES INC are CCS, TMHC, FHI, ASGN, and KMT.
- Visit TPH's SEC page to see the company's official filings. To visit the company's web site, go to www.tripointegroup.com.
TPH Valuation Summary
- In comparison to the median Consumer Cyclical stock, TPH's price/sales ratio is 12.5% higher, now standing at 0.9.
- Over the past 133 months, TPH's price/sales ratio has gone up 0.3.
Below are key valuation metrics over time for TPH.
Stock | Date | P/S | P/B | P/E | EV/EBIT |
---|---|---|---|---|---|
TPH | 2023-12-29 | 0.9 | 1.2 | 8.3 | 7.2 |
TPH | 2023-12-28 | 0.9 | 1.2 | 8.4 | 7.2 |
TPH | 2023-12-27 | 0.9 | 1.2 | 8.4 | 7.3 |
TPH | 2023-12-26 | 0.9 | 1.2 | 8.4 | 7.2 |
TPH | 2023-12-22 | 0.9 | 1.2 | 8.3 | 7.1 |
TPH | 2023-12-21 | 0.9 | 1.2 | 8.2 | 7.1 |
TPH Growth Metrics
- Its year over year net income to common stockholders growth rate is now at 51.32%.
- Its 2 year net cashflow from operations growth rate is now at -20.1%.
- The year over year revenue growth rate now stands at 18.12%.
The table below shows TPH's growth in key financial areas (numbers in millions of US dollars).
Date | Revenue | Operating Cash Flow | Net Income to Common Stock |
---|---|---|---|
2022-12-31 | 4,348.533 | 444.276 | 576.06 |
2022-09-30 | 4,035.741 | 34.012 | 520.527 |
2022-06-30 | 3,997.138 | 154.398 | 504.457 |
2022-03-31 | 3,997.513 | 273.215 | 485.943 |
2021-12-31 | 3,982.235 | 419.533 | 469.267 |
2021-09-30 | 3,833.05 | 453.818 | 436.941 |
TPH's Quality Factors
The “Quality” component of the POWR Ratings focuses on 31 different factors of a companies fundamentals and operational strength. Here are some key insights as we drill into the specifics of these quality attributes.- TPH has a Quality Grade of B, ranking ahead of 77.13% of graded US stocks.
- TPH's asset turnover comes in at 0.929 -- ranking 40th of 51 Construction stocks.
- PHM, CCS, and PRIM are the stocks whose asset turnover ratios are most correlated with TPH.
The table below shows TPH's key quality metrics over time.
Period | Asset Turnover | Gross Margin | ROIC |
---|---|---|---|
2021-09-30 | 0.929 | 0.250 | 0.123 |
2021-06-30 | 0.895 | 0.239 | 0.109 |
2021-03-31 | 0.843 | 0.232 | 0.091 |
2020-12-31 | 0.803 | 0.225 | 0.077 |
2020-09-30 | 0.831 | 0.219 | 0.077 |
2020-06-30 | 0.811 | 0.219 | 0.071 |
TPH Price Target
For more insight on analysts targets of TPH, see our TPH price target page. And for a list of of all stocks sorted by upside potential based on analyst target price, see our Top Price Target page.
Average Price Target | $29.71 | Average Broker Recommendation | 1.67 (Moderate Buy) |
TRI Pointe Group, Inc. (TPH) Company Bio
Tri Pointe Homes Inc. designs, constructs, and sells single-family homes across eight states, including Maracay Homes in Arizona, Pardee Homes in California and Nevada, Quadrant Homes in Washington, Trendmaker Homes in Texas, TRI Pointe Homes in California and Colorado, and Winchester Homes in Maryland and Virginia. The company was founded in 2009 and is based in Irvine, California.
Latest TPH News From Around the Web
Below are the latest news stories about TRI POINTE HOMES INC that investors may wish to consider to help them evaluate TPH as an investment opportunity.
Tri Pointe Homes, Inc. Announces $250 Million Stock Repurchase ProgramINCLINE VILLAGE, Nev., Dec. 21, 2023 (GLOBE NEWSWIRE) -- Tri Pointe Homes, Inc. (the “Company”) (NYSE:TPH) today announced that its Board of Directors has approved a new stock repurchase program authorizing the repurchase of up to $250 million of common stock through December 31, 2024 (the “Repurchase Program”), which replaces the stock repurchase program that the Board of Directors authorized in February 2023 (the “2023 Repurchase Program”). For the fourth quarter through December 19, 2023, und |
Tri Pointe Homes' (NYSE:TPH) five-year earnings growth trails the 25% YoY shareholder returnsThe most you can lose on any stock (assuming you don't use leverage) is 100% of your money. But on a lighter note, a... |
Tri Pointe (TPH) Upgraded to Strong Buy: Here's WhyTri Pointe (TPH) might move higher on growing optimism about its earnings prospects, which is reflected by its upgrade to a Zacks Rank #1 (Strong Buy). |
The Tri Pointe Homes Inc (TPH) Company: A Short SWOT AnalysisUnveiling the Strengths, Weaknesses, Opportunities, and Threats of Tri Pointe Homes Inc |
Tri Pointe Homes, Inc. (NYSE:TPH) Q3 2023 Earnings Call TranscriptTri Pointe Homes, Inc. (NYSE:TPH) Q3 2023 Earnings Call Transcript October 26, 2023 Tri Pointe Homes, Inc. beats earnings expectations. Reported EPS is $0.76, expectations were $0.54. Operator: Greetings and welcome to the Tri Pointe Homes Third Quarter 2023 Earnings Conference Call. At this time, all participants are in a listen-only mode. A brief question-and-answer […] |
TPH Price Returns
1-mo | 9.06% |
3-mo | 7.15% |
6-mo | 38.68% |
1-year | 51.72% |
3-year | 90.13% |
5-year | 200.08% |
YTD | 7.15% |
2023 | 90.42% |
2022 | -33.35% |
2021 | 61.68% |
2020 | 10.72% |
2019 | 42.54% |
Continue Researching TPH
Want to see what other sources are saying about TRI Pointe Group Inc's financials and stock price? Try the links below:TRI Pointe Group Inc (TPH) Stock Price | Nasdaq
TRI Pointe Group Inc (TPH) Stock Quote, History and News - Yahoo Finance
TRI Pointe Group Inc (TPH) Stock Price and Basic Information | MarketWatch
Loading social stream, please wait...