
Texas Pacific Land Trust (TPL): Price and Financial Metrics
TPL Price/Volume Stats
| Current price | $818.85 | 52-week high | $834.52 |
| Prev. close | $807.56 | 52-week low | $467.62 |
| Day low | $807.56 | Volume | 56,610 |
| Day high | $821.20 | Avg. volume | 107,615 |
| 50-day MA | $715.69 | Dividend yield | 0.59% |
| 200-day MA | $591.70 | Market Cap | 18.83B |
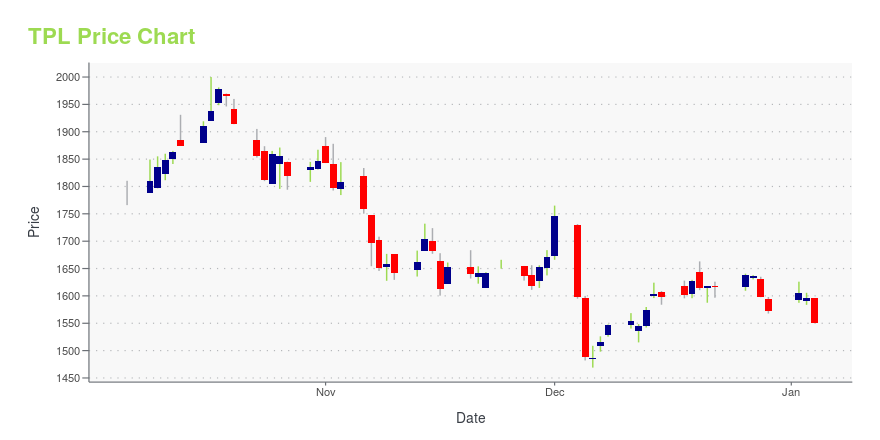
TPL Stock Price Chart Interactive Chart >
Texas Pacific Land Trust (TPL) Company Bio
Texas Pacific Land Trust owns tracts of land in Texas, previously the property of the Texas and Pacific Railway Company. The Trust issues transferable certificates of proprietary interest pro rata to the holders of certain debt securities of the Texas and Pacific Railway Company. Texas's income is derived from land sales, oil and gas royalties, grazing leases, and interest.
Latest TPL News From Around the Web
Below are the latest news stories about TEXAS PACIFIC LAND CORP that investors may wish to consider to help them evaluate TPL as an investment opportunity.
Delaware Court of Chancery Rules in Favor of Texas Pacific Land Corporation on Litigation Related to Stockholders’ AgreementDALLAS, December 04, 2023--Texas Pacific Land Corporation (NYSE: TPL) ("TPL" or the "Company") announced today that the Delaware Court of Chancery (the "Court") has ruled in favor of TPL in the litigation between the Company and Horizon Kinetics LLC, Horizon Kinetics Asset Management LLC, SoftVest Advisors, LLC and SoftVest, L.P. (collectively, the "Investor Group"), in Texas Pacific Land Corp. v. Horizon Kinetics LLC, (C.A. No. 2022-1066-JTL) (Del. Ch.). On December 1, 2023, the Court ruled tha |
Director Rhys Best's Recent Insider Purchase of Texas Pacific Land Corp SharesInsider buying can be an informative indicator for investors, as it may suggest that those with the most intimate knowledge of a company's operations believe that the stock is undervalued or that positive developments are on the horizon. |
Here's Why Texas Pacific Land Corporation's (NYSE:TPL) CEO May Deserve A RaiseKey Insights Texas Pacific Land will host its Annual General Meeting on 10th of November CEO Tyler Glover's total... |
Is Texas Pacific Land Corporation's (NYSE:TPL) Recent Stock Performance Tethered To Its Strong Fundamentals?Most readers would already be aware that Texas Pacific Land's (NYSE:TPL) stock increased significantly by 14% over the... |
Texas Pacific Land Corp (TPL) Reports Q3 2023 Earnings: Net Income Drops to $105.6 MillionRevenues of $158.0 Million, Adjusted EBITDA of $141.0 Million, and Free Cash Flow of $106.1 Million |
TPL Price Returns
| 1-mo | 11.73% |
| 3-mo | 39.63% |
| 6-mo | 67.74% |
| 1-year | 66.87% |
| 3-year | 78.50% |
| 5-year | 248.57% |
| YTD | 58.80% |
| 2023 | -32.40% |
| 2022 | 91.29% |
| 2021 | 73.25% |
| 2020 | -6.94% |
| 2019 | 45.44% |
TPL Dividends
| Ex-Dividend Date | Type | Payout Amount | Change | ||||||
|---|---|---|---|---|---|---|---|---|---|
| Loading, please wait... | |||||||||
Continue Researching TPL
Want to see what other sources are saying about Texas Pacific Land Trust's financials and stock price? Try the links below:Texas Pacific Land Trust (TPL) Stock Price | Nasdaq
Texas Pacific Land Trust (TPL) Stock Quote, History and News - Yahoo Finance
Texas Pacific Land Trust (TPL) Stock Price and Basic Information | MarketWatch
Loading social stream, please wait...