Tapestry Inc. (TPR): Price and Financial Metrics
GET POWR RATINGS... FREE!
TPR Price/Volume Stats
Current price | $41.69 | 52-week high | $47.48 |
Prev. close | $40.70 | 52-week low | $27.53 |
Day low | $40.68 | Volume | 2,130,900 |
Day high | $41.90 | Avg. volume | 3,390,719 |
50-day MA | $41.13 | Dividend yield | 2.93% |
200-day MA | $38.21 | Market Cap | 9.66B |
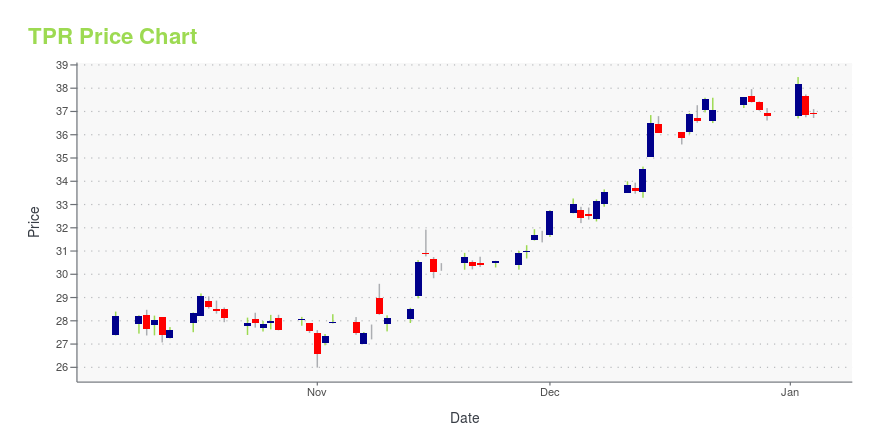
TPR Stock Price Chart Interactive Chart >
TPR POWR Grades
- Quality is the dimension where TPR ranks best; there it ranks ahead of 96.75% of US stocks.
- The strongest trend for TPR is in Sentiment, which has been heading up over the past 179 days.
- TPR's current lowest rank is in the Stability metric (where it is better than 10.9% of US stocks).
TPR Stock Summary
- With a market capitalization of $9,482,847,998, TAPESTRY INC has a greater market value than 83.8% of US stocks.
- TPR's one year PEG ratio, measuring expected growth in earnings next year relative to current common stock price is 833.29 -- higher than 97.09% of US-listed equities with positive expected earnings growth.
- Of note is the ratio of TAPESTRY INC's sales and general administrative expense to its total operating expenses; 87.44% of US stocks have a lower such ratio.
- Stocks with similar financial metrics, market capitalization, and price volatility to TAPESTRY INC are UFPI, MYRG, RS, DDS, and DCI.
- Visit TPR's SEC page to see the company's official filings. To visit the company's web site, go to www.tapestry.com.
TPR Valuation Summary
- TPR's price/sales ratio is 1.5; this is 87.5% higher than that of the median Consumer Cyclical stock.
- TPR's price/earnings ratio has moved down 19.8 over the prior 243 months.
Below are key valuation metrics over time for TPR.
Stock | Date | P/S | P/B | P/E | EV/EBIT |
---|---|---|---|---|---|
TPR | 2023-05-19 | 1.5 | 4.4 | 11.1 | 11.1 |
TPR | 2023-05-18 | 1.5 | 4.5 | 11.4 | 11.3 |
TPR | 2023-05-17 | 1.5 | 4.4 | 11.2 | 11.2 |
TPR | 2023-05-16 | 1.5 | 4.3 | 10.8 | 10.9 |
TPR | 2023-05-15 | 1.5 | 4.4 | 11.1 | 11.1 |
TPR | 2023-05-12 | 1.4 | 4.2 | 10.6 | 10.7 |
TPR Growth Metrics
- Its 5 year net income to common stockholders growth rate is now at -140.21%.
- Its year over year cash and equivalents growth rate is now at -51.2%.
- Its 4 year revenue growth rate is now at 27.75%.

The table below shows TPR's growth in key financial areas (numbers in millions of US dollars).
Date | Revenue | Operating Cash Flow | Net Income to Common Stock |
---|---|---|---|
2022-12-31 | 6,594.3 | 647.5 | 836.7 |
2022-09-30 | 6,710.1 | 661 | 824.7 |
2022-06-30 | 6,684.5 | 853.2 | 856.3 |
2022-03-31 | 6,675 | 995.5 | 867.3 |
2021-12-31 | 6,510.8 | 1,245.5 | 836.3 |
2021-09-30 | 6,055 | 1,255.5 | 829.4 |
TPR's Quality Factors
The “Quality” component of the POWR Ratings focuses on 31 different factors of a companies fundamentals and operational strength. Here are some key insights as we drill into the specifics of these quality attributes.- TPR has a Quality Grade of A, ranking ahead of 98.7% of graded US stocks.
- TPR's asset turnover comes in at 0.704 -- ranking 27th of 32 Apparel stocks.
- PVH, LULU, and VFC are the stocks whose asset turnover ratios are most correlated with TPR.
The table below shows TPR's key quality metrics over time.
Period | Asset Turnover | Gross Margin | ROIC |
---|---|---|---|
2021-07-03 | 0.704 | 0.710 | 0.160 |
2021-03-27 | 0.602 | 0.705 | 0.069 |
2020-12-26 | 0.582 | 0.671 | -0.057 |
2020-09-26 | 0.588 | 0.661 | -0.058 |
2020-06-27 | 0.605 | 0.653 | -0.080 |
2020-03-28 | 0.725 | 0.649 | -0.018 |
TPR Price Target
For more insight on analysts targets of TPR, see our TPR price target page. And for a list of of all stocks sorted by upside potential based on analyst target price, see our Top Price Target page.
Average Price Target | $53.39 | Average Broker Recommendation | 1.6 (Moderate Buy) |
Tapestry Inc. (TPR) Company Bio
Tapestry, Inc. is an American multinational luxury fashion holding company. It is based in New York City and is the parent company of three major brands: Coach New York, Kate Spade New York and Stuart Weitzman. Originally named Coach, Inc., the business changed its name to Tapestry on October 31, 2017. (Source:Wikipedia)
Latest TPR News From Around the Web
Below are the latest news stories about TAPESTRY INC that investors may wish to consider to help them evaluate TPR as an investment opportunity.
We Love Teachers! The Coach Foundation Says Thank You to the Educators Helping Their Students "Dream It Real"NORTHAMPTON, MA / ACCESSWIRE / May 19, 2023 / Tapestry, Inc. Teacher Appreciation Week Pop Up Shop The Coach Foundation surprised over 1,500 teachers with Coach, kate spade New York, and Stuart Weitzman product as part of National Teacher Appreciation ... |
Tapestry, Inc. Declares Quarterly Cash DividendNEW YORK, May 19, 2023--Tapestry, Inc. (NYSE: TPR), a leading New York-based house of iconic accessories and lifestyle brands consisting of Coach, Kate Spade, and Stuart Weitzman, today announced that its Board of Directors has declared a quarterly cash dividend of $0.30 per common share. The dividend is payable on June 26, 2023 to shareholders of record as of the close of business on June 9, 2023. |
The Tapestry Foundation Heads to Brazil for an In-Person Look at AgroforestryNORTHAMPTON, MA / ACCESSWIRE / May 18, 2023 / Tapestry, Inc. Tapestry Foundation team at Boa Vida farm In April 2023, the Tapestry Foundation visited Mato Grasso do Sul in Brazil to visit sites that are part of a pilot program sponsored by a ... |
Here's Why Tapestry (TPR) is a Strong Value StockWondering how to pick strong, market-beating stocks for your investment portfolio? Look no further than the Zacks Style Scores. |
Is Tapestry's Recent Strength the Start of a New Uptrend?Luxury fashion holding company Tapestry is the parent company of three major brands - Coach New York, Kate Spade New York and Stuart Weitzman. In this daily bar chart of , below, I can see that prices rallied from late September to a high in early January. TPR has rallied off the key moving average line and is back above the 50-day moving average line. |
TPR Price Returns
1-mo | 2.16% |
3-mo | -2.80% |
6-mo | 13.63% |
1-year | 25.26% |
3-year | 213.26% |
5-year | 9.21% |
YTD | 10.25% |
2022 | -3.32% |
2021 | 32.29% |
2020 | 16.86% |
2019 | -15.97% |
2018 | -21.39% |
TPR Dividends
Ex-Dividend Date | Type | Payout Amount | Change | ||||||
---|---|---|---|---|---|---|---|---|---|
Loading, please wait... |
Continue Researching TPR
Here are a few links from around the web to help you further your research on Tapestry Inc's stock as an investment opportunity:Tapestry Inc (TPR) Stock Price | Nasdaq
Tapestry Inc (TPR) Stock Quote, History and News - Yahoo Finance
Tapestry Inc (TPR) Stock Price and Basic Information | MarketWatch
Loading social stream, please wait...