
LendingTree, Inc. (TREE): Price and Financial Metrics
TREE Price/Volume Stats
| Current price | $55.72 | 52-week high | $59.00 |
| Prev. close | $54.72 | 52-week low | $10.12 |
| Day low | $51.36 | Volume | 511,400 |
| Day high | $59.00 | Avg. volume | 246,373 |
| 50-day MA | $44.95 | Dividend yield | N/A |
| 200-day MA | $33.83 | Market Cap | 736.90M |
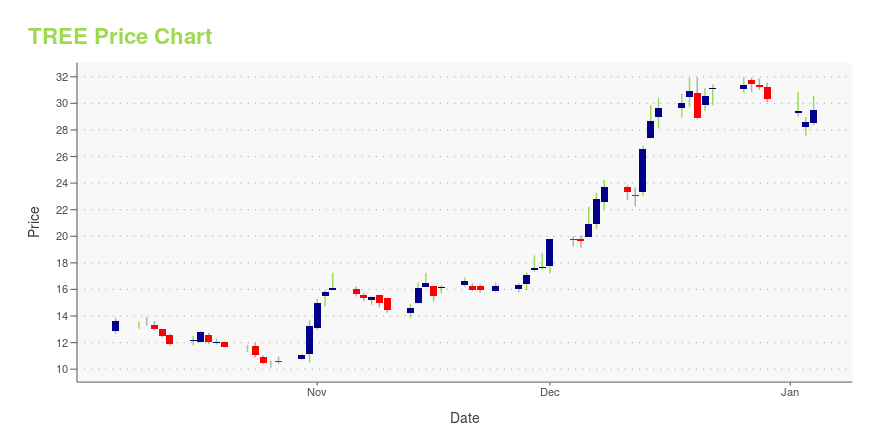
TREE Stock Price Chart Interactive Chart >
LendingTree, Inc. (TREE) Company Bio
LendingTree operates an online marketplace which provides consumers with access to lenders offering home loans, home equity loans/lines of credit, personal loans, auto loans, student loans and more. The company was founded in 2008 and is based in Charlotte, North Carolina.
Latest TREE News From Around the Web
Below are the latest news stories about LENDINGTREE INC that investors may wish to consider to help them evaluate TREE as an investment opportunity.
Zacks Industry Outlook Highlights Federal Agricultural Mortgage, LendingTree and Ocwen FinancialFederal Agricultural Mortgage, LendingTree and Ocwen Financial have been highlighted in this Industry Outlook article. |
3 Mortgage & Related Services Stocks to Watch Amid Ongoing WoesDespite high mortgage rates and low origination volumes, AGM, TREE and OCN are set to hold ground on robust servicing opportunities and a focus on improving operating leverage. |
New report finds Tesla drivers are the most accident-proneTesla drivers, according to a new study by LendingTree, have the highest accident rate of 30 major car brands analyzed. The report found that, between mid-November 2022 and mid-November 2023, Tesla drivers had 23.54 accidents per 1,000 drivers. Ram, at 22.76, and Subaru, at 20.90, were the only other brands with accident rates above 20. |
Drivers in this Stellantis brand are among the worst, study saysAlthough defensive driving techniques can be taught, dashcams can be installed, along with other preventative methods and gizmos, moving violations, road rage and accidents can happen to the best of self-declared "good drivers." Many experienced motorists can name specific brands whose owners can be labeled as "bad drivers" - but a study found that one very popular Stellantis brand tops the list of worst drivers. A recent study by LendingTree analyzed tens of millions of insurance quotes from QuoteWizard from Nov. 14, 2022 to 2023 and looked at the average rate of driving incidents, which include accidents, DUIs (driving while intoxicated) instances, speeding tickets and driving citations that include careless/reckless driving, failing to signal, as well as failure to yield. |
LendingTree (NASDAQ:TREE) shareholders are up 26% this past week, but still in the red over the last three yearsLendingTree, Inc. ( NASDAQ:TREE ) shareholders will doubtless be very grateful to see the share price up 78% in the... |
TREE Price Returns
| 1-mo | 39.33% |
| 3-mo | 47.02% |
| 6-mo | 65.73% |
| 1-year | 164.83% |
| 3-year | -71.27% |
| 5-year | -84.03% |
| YTD | 83.77% |
| 2023 | 42.15% |
| 2022 | -82.60% |
| 2021 | -55.22% |
| 2020 | -9.77% |
| 2019 | 38.20% |
Continue Researching TREE
Here are a few links from around the web to help you further your research on LendingTree Inc's stock as an investment opportunity:LendingTree Inc (TREE) Stock Price | Nasdaq
LendingTree Inc (TREE) Stock Quote, History and News - Yahoo Finance
LendingTree Inc (TREE) Stock Price and Basic Information | MarketWatch
Loading social stream, please wait...