Trex Company, Inc. (TREX): Price and Financial Metrics
GET POWR RATINGS... FREE!
TREX POWR Grades
- Quality is the dimension where TREX ranks best; there it ranks ahead of 92.57% of US stocks.
- TREX's strongest trending metric is Stability; it's been moving down over the last 179 days.
- TREX ranks lowest in Sentiment; there it ranks in the 3rd percentile.
TREX Stock Summary
- With a one year PEG ratio of 227.33, Trex Co Inc is expected to have a higher PEG ratio (a measure of how expensive a stock is relative to its expected earnings growth) than 88.97% of US stocks.
- Price to trailing twelve month operating cash flow for TREX is currently 32.86, higher than 82.92% of US stocks with positive operating cash flow.
- For TREX, its debt to operating expenses ratio is greater than that reported by merely 17.43% of US equities we're observing.
- Stocks that are quantitatively similar to TREX, based on their financial statements, market capitalization, and price volatility, are EWBC, COLB, PACW, NTB, and ATR.
- Visit TREX's SEC page to see the company's official filings. To visit the company's web site, go to www.trex.com.
TREX Valuation Summary
- TREX's price/sales ratio is 12.9; this is 460.87% higher than that of the median Basic Materials stock.
- Over the past 243 months, TREX's price/earnings ratio has gone up 43.2.
- Over the past 243 months, TREX's price/sales ratio has gone up 9.9.
Below are key valuation metrics over time for TREX.
Stock | Date | P/S | P/B | P/E | EV/EBIT |
---|---|---|---|---|---|
TREX | 2021-09-03 | 12.9 | 20.2 | 67.0 | 50.5 |
TREX | 2021-09-02 | 13.0 | 20.3 | 67.3 | 50.7 |
TREX | 2021-09-01 | 12.6 | 19.7 | 65.4 | 49.3 |
TREX | 2021-08-31 | 12.4 | 19.5 | 64.6 | 48.7 |
TREX | 2021-08-30 | 12.7 | 19.8 | 65.7 | 49.5 |
TREX | 2021-08-27 | 12.6 | 19.7 | 65.3 | 49.2 |
TREX Growth Metrics
- Its 5 year net cashflow from operations growth rate is now at 166.19%.
- Its 2 year revenue growth rate is now at 29.52%.
- The 4 year cash and equivalents growth rate now stands at 40.35%.

The table below shows TREX's growth in key financial areas (numbers in millions of US dollars).
Date | Revenue | Operating Cash Flow | Net Income to Common Stock |
---|---|---|---|
2021-12-31 | 1,196.952 | 258.064 | 208.737 |
2021-09-30 | 1,121.278 | 287.839 | 227.006 |
2021-06-30 | 1,016.908 | 201.384 | 195.921 |
2021-03-31 | 925.96 | 153.488 | 181.773 |
2020-12-31 | 880.831 | 187.294 | 175.631 |
2020-09-30 | 817.317 | 69.88 | 167.827 |
TREX's Quality Factors
The “Quality” component of the POWR Ratings focuses on 31 different factors of a companies fundamentals and operational strength. Here are some key insights as we drill into the specifics of these quality attributes.- TREX has a Quality Grade of B, ranking ahead of 84.59% of graded US stocks.
- TREX's asset turnover comes in at 1.237 -- ranking 10th of 60 Construction Materials stocks.
- DOOR, PATK, and KOP are the stocks whose asset turnover ratios are most correlated with TREX.
The table below shows TREX's key quality metrics over time.
Period | Asset Turnover | Gross Margin | ROIC |
---|---|---|---|
2021-06-30 | 1.237 | 0.385 | 0.415 |
2021-03-31 | 1.210 | 0.395 | 0.423 |
2020-12-31 | 1.263 | 0.408 | 0.458 |
2020-09-30 | 1.251 | 0.414 | 0.476 |
2020-06-30 | 1.266 | 0.430 | 0.539 |
2020-03-31 | 1.315 | 0.427 | 0.567 |
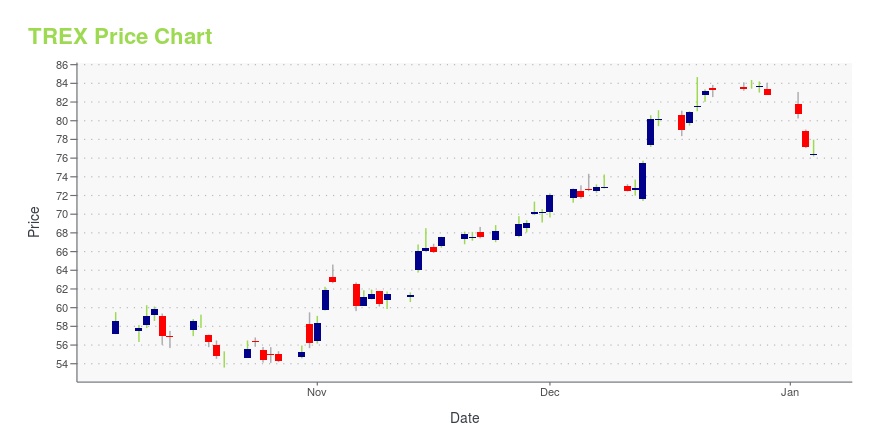
TREX Stock Price Chart Interactive Chart >
TREX Price/Volume Stats
Current price | $65.31 | 52-week high | $140.98 |
Prev. close | $62.50 | 52-week low | $51.76 |
Day low | $62.24 | Volume | 884,605 |
Day high | $65.63 | Avg. volume | 1,390,102 |
50-day MA | $63.79 | Dividend yield | N/A |
200-day MA | $96.95 | Market Cap | 7.39B |
Trex Company, Inc. (TREX) Company Bio
Trex Company manufactures and distributes wood/plastic composite products, and related accessories primarily for the residential and commercial decking, and railing applications in the United States. The company was founded in 1996 and is based in Winchester, Virginia.
Latest TREX News From Around the Web
Below are the latest news stories about Trex Co Inc that investors may wish to consider to help them evaluate TREX as an investment opportunity.
Trex Q4 2021 Earnings PreviewTrex (NYSE:TREX) is scheduled to announce Q4 earnings results on Monday, February 28th, after market close. The consensus EPS Estimate is $0.53 (+43.2% Y/Y) and the consensus Revenue Estimate is $302.64M (+32.6% Y/Y). Over the last 1 year, TREX has beaten EPS estimates 100% of the time and has beaten... |
Trex (TREX) Earnings Expected to Grow: Should You Buy?Trex (TREX) doesn't possess the right combination of the two key ingredients for a likely earnings beat in its upcoming report. Get prepared with the key expectations. |
Here’s Why You Should Invest in Trex Company (TREX)’s SharesAlger, an investment management firm, published its “Alger Small Cap Focus Fund” fourth quarter 2021 investor letter – a copy of which can be downloaded here. |
Baron Funds is Full of Hope in Trex Company (TREX)Baron Funds, an asset management firm, published its “Baron Growth Fund” fourth quarter 2021 investor letter – a copy of which can be downloaded here. |
UFP Industries (UFPI) Beats Q4 Earnings and Revenue EstimatesUFP Industries (UFPI) delivered earnings and revenue surprises of 75.20% and 4.79%, respectively, for the quarter ended December 2021. Do the numbers hold clues to what lies ahead for the stock? |
TREX Price Returns
1-mo | 13.56% |
3-mo | -27.73% |
6-mo | -50.16% |
1-year | -32.91% |
3-year | 99.42% |
5-year | 316.45% |
YTD | -51.63% |
2021 | 61.29% |
2020 | 86.29% |
2019 | 51.42% |
2018 | 9.53% |
2017 | 68.31% |
Continue Researching TREX
Here are a few links from around the web to help you further your research on Trex Co Inc's stock as an investment opportunity:Trex Co Inc (TREX) Stock Price | Nasdaq
Trex Co Inc (TREX) Stock Quote, History and News - Yahoo Finance
Trex Co Inc (TREX) Stock Price and Basic Information | MarketWatch
Loading social stream, please wait...