
Interactive Strength Inc. (TRNR): Price and Financial Metrics
TRNR Price/Volume Stats
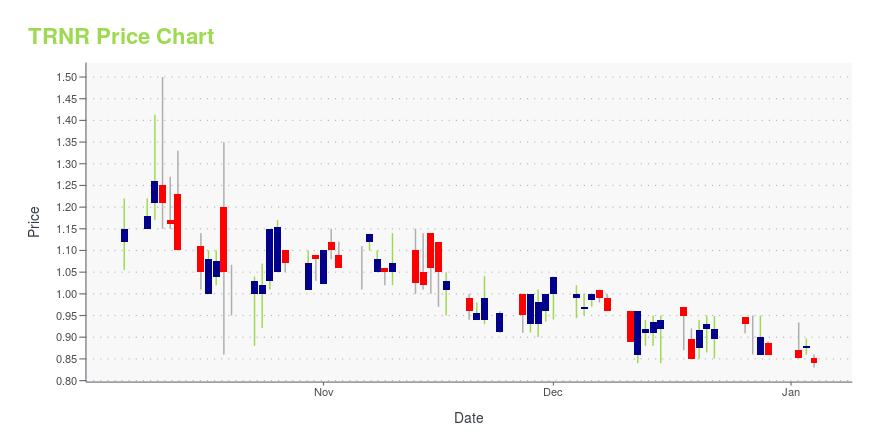
| Current price | $0.70 | 52-week high | $850.00 |
| Prev. close | $0.81 | 52-week low | $0.56 |
| Day low | $0.68 | Volume | 2,165,300 |
| Day high | $0.77 | Avg. volume | 8,331,446 |
| 50-day MA | $0.84 | Dividend yield | N/A |
| 200-day MA | $7.25 | Market Cap | 7.02M |
TRNR Stock Price Chart Interactive Chart >
TRNR Price Returns
| 1-mo | -28.57% |
| 3-mo | -44.44% |
| 6-mo | -76.97% |
| 1-year | -99.76% |
| 3-year | N/A |
| 5-year | N/A |
| YTD | -75.44% |
| 2024 | -99.92% |
| 2023 | N/A |
| 2022 | N/A |
| 2021 | N/A |
| 2020 | N/A |
Loading social stream, please wait...