
Interactive Strength Inc. (TRNR): Price and Financial Metrics
TRNR Price/Volume Stats
| Current price | $0.71 | 52-week high | $114.40 |
| Prev. close | $0.85 | 52-week low | $0.66 |
| Day low | $0.70 | Volume | 622,184 |
| Day high | $0.79 | Avg. volume | 598,082 |
| 50-day MA | $3.68 | Dividend yield | N/A |
| 200-day MA | $21.11 | Market Cap | 472.15K |
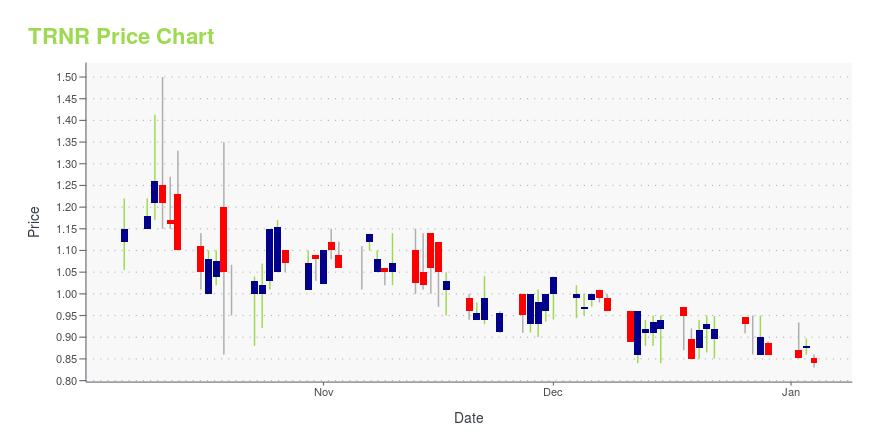
TRNR Stock Price Chart Interactive Chart >
Latest TRNR News From Around the Web
Below are the latest news stories about INTERACTIVE STRENGTH INC that investors may wish to consider to help them evaluate TRNR as an investment opportunity.
Interactive Strength Inc. d/b/a FORME Reports Third Quarter 2023 ResultsNet Loss and Earnings per Diluted Share of $10.4 million and $0.73 Adjusted EBITDA was a $3.4 million loss, a $5.8 million improvement versus third quarter of 2022 Entered into a definitive agreement to acquire substantially all of the assets of CLMBR, Inc. AUSTIN, TX, Nov. 14, 2023 (GLOBE NEWSWIRE) -- via NewMediaWire –Interactive Strength Inc. d/b/a FORME (the "Company", or “FORME”) (NASDAQ: TRNR), today announced its financial results for the third quarter of 2023. The Company incurred a net |
Insiders In Interactive Strength Still Down 80% On US$720.0k InvestmentInsiders who bought US$720.0k worth of Interactive Strength Inc. ( NASDAQ:TRNR ) stock in the last year have seen some... |
Interactive Strength, Inc. d/b/a FORME (Nasdaq: TRNR) to Present at the Webull LIVE! with Corporate Connect: Virtual Consumer Tech WebinarInteractive Strength recently signed agreement to acquire CLMBR, creating a high-growth, B2B focused, connected fitness platform Trent Ward (CEO) to present on Wednesday, October 18th at 3:00PM/ET AUSTIN, TX, Oct. 17, 2023 (GLOBE NEWSWIRE) -- via NewMediaWire - Interactive Strength Inc. d/b/a FORME (Nasdaq: TRNR), maker of premium smart home gyms and provider of virtual personal training services, announces Trent Ward, CEO will present at the Webull LIVE! with Corporate Connect: Virtual Consumer |
Interactive Strength, Inc. d/b/a FORME Announces Strategic Partnership with HSA/FSA Payment Provider TruemedCollaboration incentivizes U.S. customers to spend funds from HSA (Health Savings Accounts) and FSA (Flexible Spending Accounts) programs to purchase FORME's personal training and smart home gyms with pre-tax dollarsPartnership enhances FORME’s B2C positioning as a growth driver to complement the B2B initiative of acquiring CLMBR that was announced on October 11 AUSTIN, TX, Oct. 13, 2023 (GLOBE NEWSWIRE) -- via NewMediaWire - Interactive Strength Inc. d/b/a FORME (Nasdaq: TRNR), maker of premium |
FORME Eyes Sustainable Growth Through CLMBR Acquisition Using A B2B/B2C Multi-channel Strategy To ‘Avoid Mistakes Of Peloton, Other Struggling Connected Fitness Companies’AUSTIN, TX / ACCESSWIRE / October 13, 2023 / It's been a rough couple of years for connected fitness as the pandemic-era bubble burst leaving once shining growth stocks like Peloton grappling with waning demand and high production costs. However, ... |
TRNR Price Returns
| 1-mo | -64.85% |
| 3-mo | -91.37% |
| 6-mo | -97.53% |
| 1-year | -99.09% |
| 3-year | N/A |
| 5-year | N/A |
| YTD | -97.94% |
| 2023 | N/A |
| 2022 | N/A |
| 2021 | N/A |
| 2020 | N/A |
| 2019 | N/A |
Loading social stream, please wait...