Transcat, Inc. (TRNS): Price and Financial Metrics
TRNS Price/Volume Stats
Current price | $93.00 | 52-week high | $94.10 |
Prev. close | $92.97 | 52-week low | $50.32 |
Day low | $90.01 | Volume | 22,090 |
Day high | $93.34 | Avg. volume | 46,911 |
50-day MA | $84.33 | Dividend yield | N/A |
200-day MA | $80.48 | Market Cap | 710.71M |
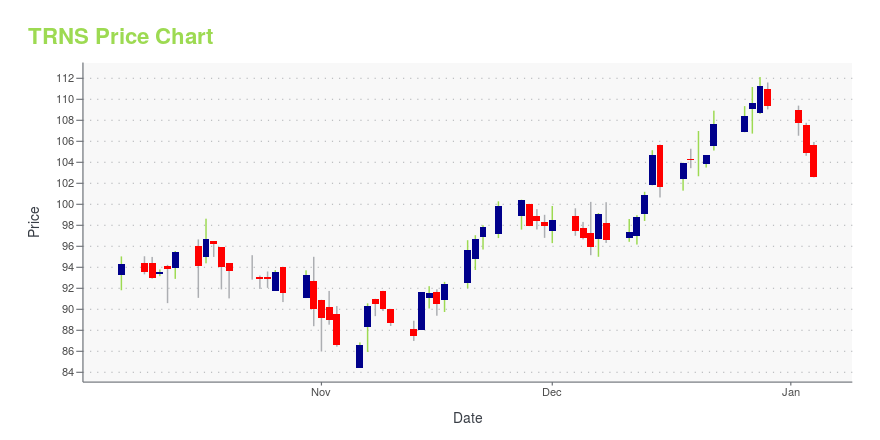
TRNS Stock Price Chart Interactive Chart >
TRNS POWR Grades
- Sentiment is the dimension where TRNS ranks best; there it ranks ahead of 79.73% of US stocks.
- TRNS's strongest trending metric is Stability; it's been moving down over the last 179 days.
- TRNS ranks lowest in Value; there it ranks in the 18th percentile.
TRNS Stock Summary
- With a one year PEG ratio of 1,238.71, TRANSCAT INC is expected to have a higher PEG ratio (a measure of how expensive a stock is relative to its expected earnings growth) than 98.2% of US stocks.
- With a price/earnings ratio of 67.28, TRANSCAT INC P/E ratio is greater than that of about 92.09% of stocks in our set with positive earnings.
- The price/operating cash flow metric for TRANSCAT INC is higher than 88.25% of stocks in our set with a positive cash flow.
- Stocks that are quantitatively similar to TRNS, based on their financial statements, market capitalization, and price volatility, are MIDD, CRAI, BFAM, ATKR, and CRVL.
- TRNS's SEC filings can be seen here. And to visit TRANSCAT INC's official web site, go to www.transcat.com.
TRNS Valuation Summary
- TRNS's price/sales ratio is 2.9; this is 52.63% higher than that of the median Industrials stock.
- Over the past 243 months, TRNS's price/earnings ratio has gone up 66.7.
Below are key valuation metrics over time for TRNS.
Stock | Date | P/S | P/B | P/E | EV/EBIT |
---|---|---|---|---|---|
TRNS | 2023-05-19 | 2.9 | 6.9 | 65.4 | 48.3 |
TRNS | 2023-05-18 | 3.0 | 7.0 | 65.8 | 48.5 |
TRNS | 2023-05-17 | 2.9 | 6.7 | 63.5 | 47.0 |
TRNS | 2023-05-16 | 2.8 | 6.6 | 62.0 | 46.0 |
TRNS | 2023-05-15 | 2.9 | 6.8 | 64.0 | 47.4 |
TRNS | 2023-05-12 | 2.9 | 6.7 | 63.6 | 47.0 |
TRNS Growth Metrics
- Its 4 year cash and equivalents growth rate is now at -40.74%.
- The 5 year revenue growth rate now stands at 20.29%.
- Its year over year revenue growth rate is now at 18.24%.

The table below shows TRNS's growth in key financial areas (numbers in millions of US dollars).
Date | Revenue | Operating Cash Flow | Net Income to Common Stock |
---|---|---|---|
2022-12-31 | 224.382 | 19.215 | 10.078 |
2022-09-30 | 217.882 | 15.351 | 10.106 |
2022-06-30 | 211.83 | 17.606 | 10.764 |
2022-03-31 | 204.959 | 17.618 | 11.38 |
2021-12-31 | 197.841 | 20.37 | 11.54 |
2021-09-30 | 191.001 | 18.665 | 11.672 |
TRNS's Quality Factors
The “Quality” component of the POWR Ratings focuses on 31 different factors of a companies fundamentals and operational strength. Here are some key insights as we drill into the specifics of these quality attributes.- TRNS has a Quality Grade of C, ranking ahead of 63.38% of graded US stocks.
- TRNS's asset turnover comes in at 1.383 -- ranking 3rd of 75 Measuring and Control Equipment stocks.
- TER, SMIT, and PBIO are the stocks whose asset turnover ratios are most correlated with TRNS.
The table below shows TRNS's key quality metrics over time.
Period | Asset Turnover | Gross Margin | ROIC |
---|---|---|---|
2021-09-25 | 1.383 | 0.279 | 0.152 |
2021-06-26 | 1.401 | 0.276 | 0.157 |
2021-03-27 | 1.351 | 0.266 | 0.125 |
2020-12-26 | 1.338 | 0.259 | 0.113 |
2020-09-26 | 1.377 | 0.253 | 0.111 |
2020-06-27 | 1.410 | 0.247 | 0.111 |
TRNS Price Target
For more insight on analysts targets of TRNS, see our TRNS price target page. And for a list of of all stocks sorted by upside potential based on analyst target price, see our Top Price Target page.
Average Price Target | $70.50 | Average Broker Recommendation | 1.42 (Moderate Buy) |
Transcat, Inc. (TRNS) Company Bio
Transcat, Inc. provides calibration and laboratory instrument services in the United States, Canada, and internationally. It operates in two segments, Service and Distribution. The Service segment offers calibration, repair, inspection, analytical qualifications, preventative maintenance, consulting, and other related services. The company was founded in 1964 and is based in Rochester, New York.
Latest TRNS News From Around the Web
Below are the latest news stories about TRANSCAT INC that investors may wish to consider to help them evaluate TRNS as an investment opportunity.
Transcat (TRNS) Stock Exceeded Expectations in Q1Conestoga Capital Advisors, an asset management company, released its “Micro Cap Strategy” first-quarter 2023 investor letter. A copy of the same can be downloaded here. The Micro Cap Composite rose 2.93% net of fees in the first quarter, compared to the Russell Microcap Growth Index’s 0.76% return. The Strategy posted 10.45% annualized returns since its inception […] |
Transcat Full Year 2023 Earnings: EPS: US$1.42 (vs US$1.52 in FY 2022)Transcat ( NASDAQ:TRNS ) Full Year 2023 Results Key Financial Results Revenue: US$230.6m (up 13% from FY 2022). Net... |
Q4 2023 Transcat Inc Earnings CallQ4 2023 Transcat Inc Earnings Call |
Transcat, Inc. (TRNS) Beats Q4 Earnings and Revenue EstimatesTranscat, Inc. (TRNS) delivered earnings and revenue surprises of 37.14% and 3.94%, respectively, for the quarter ended March 2023. Do the numbers hold clues to what lies ahead for the stock? |
Transcat Reports Record Revenue and Gross Margins for Fourth Quarter and Full Year 2023ROCHESTER, N.Y., May 22, 2023--Transcat, Inc. (Nasdaq: TRNS) ("Transcat" or the "Company"), a leading provider of accredited calibration, repair, inspection and laboratory instrument services and value-added distributor of professional grade handheld test, measurement and control instrumentation, today reported financial results for its fourth quarter and fiscal year ended March 25, 2023 ("fiscal 2023"). Results include the previously reported acquisitions of Upstate Metrology, Inc. ("Upstate Me |
TRNS Price Returns
1-mo | 13.89% |
3-mo | 8.80% |
6-mo | 23.92% |
1-year | 45.65% |
3-year | 230.73% |
5-year | 368.51% |
YTD | 31.23% |
2022 | -23.33% |
2021 | 166.52% |
2020 | 8.85% |
2019 | 67.51% |
2018 | 33.47% |
Continue Researching TRNS
Want to see what other sources are saying about Transcat Inc's financials and stock price? Try the links below:Transcat Inc (TRNS) Stock Price | Nasdaq
Transcat Inc (TRNS) Stock Quote, History and News - Yahoo Finance
Transcat Inc (TRNS) Stock Price and Basic Information | MarketWatch
Loading social stream, please wait...