TriMas Corporation (TRS): Price and Financial Metrics
TRS Price/Volume Stats
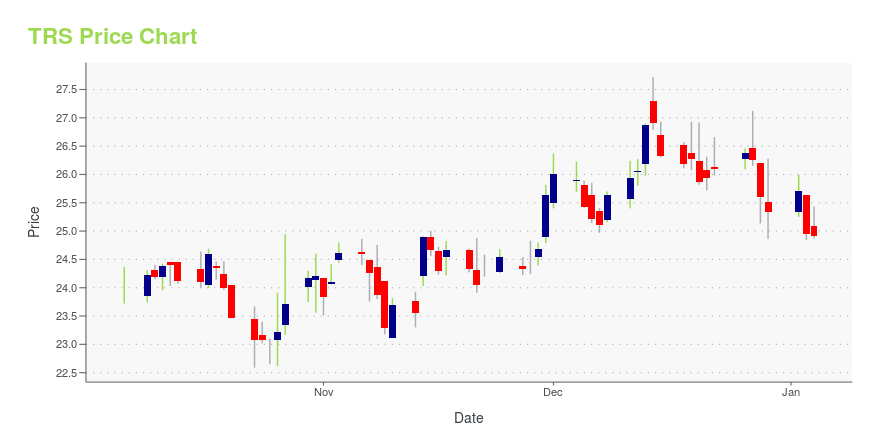
Current price | $24.20 | 52-week high | $31.89 |
Prev. close | $24.52 | 52-week low | $21.41 |
Day low | $24.01 | Volume | 61,615 |
Day high | $24.48 | Avg. volume | 109,424 |
50-day MA | $25.77 | Dividend yield | 0.65% |
200-day MA | $27.29 | Market Cap | 1.00B |
TRS Stock Price Chart Interactive Chart >
TRS POWR Grades
- Stability is the dimension where TRS ranks best; there it ranks ahead of 86.29% of US stocks.
- TRS's strongest trending metric is Growth; it's been moving up over the last 177 days.
- TRS ranks lowest in Value; there it ranks in the 11th percentile.
TRS Stock Summary
- Of note is the ratio of TRIMAS CORP's sales and general administrative expense to its total operating expenses; 99.33% of US stocks have a lower such ratio.
- For TRS, its debt to operating expenses ratio is greater than that reported by 78.59% of US equities we're observing.
- The volatility of TRIMAS CORP's share price is greater than that of merely 16.93% US stocks with at least 200 days of trading history.
- Stocks that are quantitatively similar to TRS, based on their financial statements, market capitalization, and price volatility, are ROAD, NAII, FDP, MATX, and ORN.
- TRS's SEC filings can be seen here. And to visit TRIMAS CORP's official web site, go to www.trimascorp.com.
TRS Valuation Summary
- TRS's EV/EBIT ratio is 17.8; this is 25.8% higher than that of the median Consumer Cyclical stock.
- Over the past 199 months, TRS's price/sales ratio has gone up 0.9.
Below are key valuation metrics over time for TRS.
Stock | Date | P/S | P/B | P/E | EV/EBIT |
---|---|---|---|---|---|
TRS | 2023-09-13 | 1.1 | 1.5 | 20.8 | 17.8 |
TRS | 2023-09-12 | 1.2 | 1.5 | 20.9 | 17.8 |
TRS | 2023-09-11 | 1.2 | 1.5 | 20.8 | 17.8 |
TRS | 2023-09-08 | 1.2 | 1.5 | 20.9 | 17.9 |
TRS | 2023-09-07 | 1.2 | 1.5 | 21.0 | 17.9 |
TRS | 2023-09-06 | 1.2 | 1.6 | 21.4 | 18.1 |
TRS Growth Metrics
- The year over year cash and equivalents growth rate now stands at -86.03%.
- The 3 year revenue growth rate now stands at -0.75%.
- Its 5 year cash and equivalents growth rate is now at 810.38%.

The table below shows TRS's growth in key financial areas (numbers in millions of US dollars).
Date | Revenue | Operating Cash Flow | Net Income to Common Stock |
---|---|---|---|
2022-12-31 | 883.83 | 72.57 | 66.17 |
2022-09-30 | 889.49 | 103.12 | 60.15 |
2022-06-30 | 893.38 | 119.24 | 66.44 |
2022-03-31 | 874.69 | 124.15 | 58.42 |
2021-12-31 | 857.11 | 134.22 | 57.31 |
2021-09-30 | 836.31 | 126.04 | 68.18 |
TRS's Quality Factors
The “Quality” component of the POWR Ratings focuses on 31 different factors of a companies fundamentals and operational strength. Here are some key insights as we drill into the specifics of these quality attributes.- TRS has a Quality Grade of C, ranking ahead of 73.47% of graded US stocks.
- TRS's asset turnover comes in at 0.638 -- ranking 6th of 7 Fabricated Products stocks.
- MTRN, PKOH, and GTLS are the stocks whose asset turnover ratios are most correlated with TRS.
The table below shows TRS's key quality metrics over time.
Period | Asset Turnover | Gross Margin | ROIC |
---|---|---|---|
2021-09-30 | 0.638 | 0.256 | 0.094 |
2021-06-30 | 0.643 | 0.256 | -0.064 |
2021-03-31 | 0.635 | 0.236 | -0.107 |
2020-12-31 | 0.645 | 0.236 | -0.107 |
2020-09-30 | 0.509 | 0.235 | -0.082 |
2020-06-30 | 0.529 | 0.236 | 0.091 |
TRS Price Target
For more insight on analysts targets of TRS, see our TRS price target page. And for a list of of all stocks sorted by upside potential based on analyst target price, see our Top Price Target page.
Average Price Target | $47.00 | Average Broker Recommendation | 1.5 (Moderate Buy) |
TriMas Corporation (TRS) Company Bio
TriMas Corporation provides engineered and applied products for growing markets worldwide. TriMas is organized into four reportable segments: Packaging, Aerospace, Energy and Engineered Components. The company was founded in 1989 and is based in Bloomfield Hills, Michigan.
Latest TRS News From Around the Web
Below are the latest news stories about TRIMAS CORP that investors may wish to consider to help them evaluate TRS as an investment opportunity.
TriMas Packaging to Attend Luxe Pack Monaco 2023 on October 2-4BLOOMFIELD HILLS, Mich., September 20, 2023--TriMas Packaging, the largest division of TriMas (NASDAQ: TRS), will exhibit at Luxe Pack Monaco 2023 at the Grimaldi Forum in the Ravel Hall, at Booth #RD10, on October 2-4. Luxe Pack, the premier trade show for luxury packaging solutions, features global packaging manufacturers and their most creative innovations. It has established itself as an essential sourcing opportunity for brands across all beauty and luxury-related sectors, such as cosmetics |
TriMas Packaging Streamlines Operations With Successful Production Asset RelocationBLOOMFIELD HILLS, Mich., September 14, 2023--TriMas (NASDAQ: TRS) today announced that its TriMas Packaging group has successfully completed, ahead of schedule, the previously announced relocation of certain production assets from a California manufacturing facility to other facilities in Indiana and Arkansas. As a result, TriMas Packaging will be exiting a 160,000 sq. ft. leased facility in Rohnert Park, California, by the end of 2023. |
Are TriMas Corporation's (NASDAQ:TRS) Mixed Financials Driving The Negative Sentiment?TriMas (NASDAQ:TRS) has had a rough three months with its share price down 12%. It seems that the market might have... |
TriMas (TRS) Stock Down 12% in a Year: Is a Revival Likely?Weak packaging demand, escalating raw material costs and supply-chain constraints are impacting TriMas' (TRS) results and price performance. |
TriMas (TRS) Q2 Earnings Match Estimates, Sales Dip Y/YTriMas' (TRS) Q2 earnings bear the brunt of weak demand in the packaging segment owing to customer destocking and lower spending. |
TRS Price Returns
1-mo | -5.76% |
3-mo | -9.32% |
6-mo | -11.50% |
1-year | -3.65% |
3-year | 7.25% |
5-year | -20.15% |
YTD | -12.37% |
2022 | -24.60% |
2021 | 16.97% |
2020 | 0.83% |
2019 | 15.10% |
2018 | 2.02% |
TRS Dividends
Ex-Dividend Date | Type | Payout Amount | Change | ||||||
---|---|---|---|---|---|---|---|---|---|
Loading, please wait... |
Continue Researching TRS
Want to do more research on Trimas Corp's stock and its price? Try the links below:Trimas Corp (TRS) Stock Price | Nasdaq
Trimas Corp (TRS) Stock Quote, History and News - Yahoo Finance
Trimas Corp (TRS) Stock Price and Basic Information | MarketWatch
Loading social stream, please wait...