Tractor Supply Co. (TSCO): Price and Financial Metrics
GET POWR RATINGS... FREE!
TSCO POWR Grades
- TSCO scores best on the Growth dimension, with a Growth rank ahead of 84.1% of US stocks.
- TSCO's strongest trending metric is Quality; it's been moving down over the last 177 days.
- TSCO's current lowest rank is in the Momentum metric (where it is better than 28.23% of US stocks).
TSCO Stock Summary
- TSCO has a higher market value than 91.43% of US stocks; more precisely, its current market capitalization is $25,673,867,403.
- TRACTOR SUPPLY CO's capital turnover -- a measure of revenue relative to shareholder's equity -- is better than 94.62% of US listed stocks.
- In terms of volatility of its share price, TSCO is more volatile than only 12.94% of stocks we're observing.
- Stocks that are quantitatively similar to TSCO, based on their financial statements, market capitalization, and price volatility, are GPC, ULTA, GWW, JBHT, and CBRE.
- Visit TSCO's SEC page to see the company's official filings. To visit the company's web site, go to www.tractorsupply.com.
TSCO Valuation Summary
- In comparison to the median Consumer Cyclical stock, TSCO's price/sales ratio is 13.64% lower, now standing at 1.9.
- Over the past 243 months, TSCO's price/sales ratio has gone up 1.4.
Below are key valuation metrics over time for TSCO.
Stock | Date | P/S | P/B | P/E | EV/EBIT |
---|---|---|---|---|---|
TSCO | 2023-02-02 | 1.9 | 13.1 | 24.5 | 21.4 |
TSCO | 2023-02-01 | 1.9 | 13.1 | 24.5 | 21.4 |
TSCO | 2023-01-31 | 1.9 | 13.0 | 24.2 | 21.2 |
TSCO | 2023-01-30 | 1.8 | 12.7 | 23.7 | 20.8 |
TSCO | 2023-01-27 | 1.8 | 12.8 | 24.0 | 21.0 |
TSCO | 2023-01-26 | 1.9 | 12.9 | 24.1 | 21.1 |
TSCO Growth Metrics
- Its 5 year net cashflow from operations growth rate is now at 108.97%.
- Its 3 year cash and equivalents growth rate is now at 296.65%.
- Its 3 year price growth rate is now at 99.28%.

The table below shows TSCO's growth in key financial areas (numbers in millions of US dollars).
Date | Revenue | Operating Cash Flow | Net Income to Common Stock |
---|---|---|---|
2022-09-30 | 13,517.63 | 893.213 | 1,039.18 |
2022-06-30 | 13,264.75 | 955.418 | 1,029.443 |
2022-03-31 | 12,962.9 | 1,020.669 | 1,002.987 |
2021-12-31 | 12,731.1 | 1,138.72 | 997.114 |
2021-09-30 | 12,290.09 | 1,261.377 | 911.669 |
2021-06-30 | 11,878.73 | 1,210.284 | 877.879 |
TSCO's Quality Factors
The “Quality” component of the POWR Ratings focuses on 31 different factors of a companies fundamentals and operational strength. Here are some key insights as we drill into the specifics of these quality attributes.- TSCO has a Quality Grade of C, ranking ahead of 67.93% of graded US stocks.
- TSCO's asset turnover comes in at 1.647 -- ranking 67th of 165 Retail stocks.
- SFM, TA, and FAST are the stocks whose asset turnover ratios are most correlated with TSCO.
The table below shows TSCO's key quality metrics over time.
Period | Asset Turnover | Gross Margin | ROIC |
---|---|---|---|
2021-09-25 | 1.647 | 0.354 | 0.151 |
2021-06-26 | 1.641 | 0.355 | 0.153 |
2021-03-27 | 1.643 | 0.357 | 0.155 |
2020-12-26 | 1.602 | 0.354 | 0.142 |
2020-09-26 | 1.605 | 0.353 | 0.147 |
2020-06-27 | 1.596 | 0.349 | 0.134 |
TSCO Price Target
For more insight on analysts targets of TSCO, see our TSCO price target page. And for a list of of all stocks sorted by upside potential based on analyst target price, see our Top Price Target page.
Average Price Target | $201.92 | Average Broker Recommendation | 1.68 (Moderate Buy) |
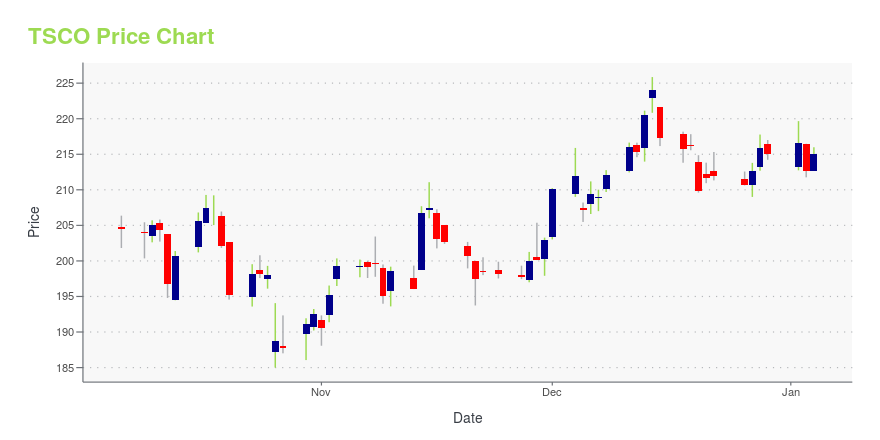
TSCO Stock Price Chart Interactive Chart >
TSCO Price/Volume Stats
Current price | $231.82 | 52-week high | $241.54 |
Prev. close | $232.42 | 52-week low | $166.49 |
Day low | $225.96 | Volume | 408,492 |
Day high | $231.82 | Avg. volume | 1,172,334 |
50-day MA | $220.09 | Dividend yield | 1.58% |
200-day MA | $203.97 | Market Cap | 25.61B |
Tractor Supply Co. (TSCO) Company Bio
Tractor Supply Company (also known as TSCO or TSC), founded in 1938, is an American retail chain of stores that sells products for home improvement, agriculture, lawn and garden maintenance, livestock, equine and pet care for recreational farmers and ranchers, pet owners, and landowners. The company has 2,000 stores and is headquartered in Brentwood, TN. It is publicly traded on the NASDAQ under the ticker symbol TSCO and is a Fortune 500 company. (Source:Wikipedia)
Latest TSCO News From Around the Web
Below are the latest news stories about TRACTOR SUPPLY CO that investors may wish to consider to help them evaluate TSCO as an investment opportunity.
Tractor Supply (TSCO) is a Top-Ranked Value Stock: Should You Buy?Whether you're a value, growth, or momentum investor, finding strong stocks becomes easier with the Zacks Style Scores, a top feature of the Zacks Premium research service. |
1 Dividend Stock to Buy With Incredible Long-Term PotentialThe rural lifestyle retail company Tractor Supply (NASDAQ: TSCO) fits this profile to a T in my opinion. Let's dig into the company's fundamentals and valuation to better understand what makes it such a compelling buy for dividend growth investors. This suggests that there will be a significant rise in demand for rural lifestyle products. |
Raising Chickens for Cheaper Eggs Gets Expensive FastGrocery shoppers, frustrated by the record prices of a dozen eggs, are increasingly choosing to go right to the source by bringing chickens home. The price for a carton of eggs is up 60% year-over-year, according to the latest Consumer Price Index. Tractor Supply , the industry’s biggest seller, says it has more than doubled its live chicken business since 2018. |
Where Will Tractor Supply Be in 5 Years?Tractor Supply (NASDAQ: TSCO) is one of the primary beneficiaries. The rural-lifestyle retailer just reported blowout third-quarter earnings. Although its 10-year track record of reporting double-digit e-commerce sales growth was broken earlier this fiscal year, online sales continue to expand and remain a key component of Tractor Supply's long-term strategy to reach new markets and customers. It took Tractor Supply 72 years to open 1,000 stores, then just 10 years to open its next 1,000 locations. |
What Makes Tractor Supply Such A Powerful Dividend Growth Stock (NASDAQ:TSCO)Tractor Supply has a 1.6% dividend yield and high and sustainable dividend growth. Read more to see my thoughts on TSCO stock and my recommendation. |
TSCO Price Returns
1-mo | 4.59% |
3-mo | 14.46% |
6-mo | 19.99% |
1-year | 8.50% |
3-year | 150.29% |
5-year | 277.25% |
YTD | 3.04% |
2022 | -3.97% |
2021 | 71.57% |
2020 | 52.33% |
2019 | 13.53% |
2018 | 13.34% |
TSCO Dividends
Ex-Dividend Date | Type | Payout Amount | Change | ||||||
---|---|---|---|---|---|---|---|---|---|
Loading, please wait... |
Continue Researching TSCO
Here are a few links from around the web to help you further your research on Tractor Supply Co's stock as an investment opportunity:Tractor Supply Co (TSCO) Stock Price | Nasdaq
Tractor Supply Co (TSCO) Stock Quote, History and News - Yahoo Finance
Tractor Supply Co (TSCO) Stock Price and Basic Information | MarketWatch
Loading social stream, please wait...