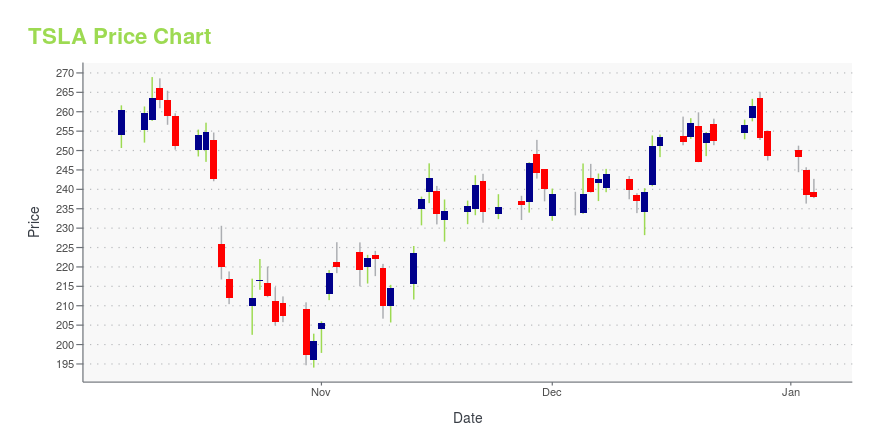
Tesla, Inc. (TSLA): Price and Financial Metrics
TSLA Price/Volume Stats
Current price | $201.16 | 52-week high | $314.67 |
Prev. close | $193.17 | 52-week low | $101.81 |
Day low | $197.53 | Volume | 128,818,700 |
Day high | $204.48 | Avg. volume | 155,610,859 |
50-day MA | $179.16 | Dividend yield | N/A |
200-day MA | $199.79 | Market Cap | 637.58B |
TSLA Stock Price Chart Interactive Chart >
TSLA POWR Grades
- TSLA scores best on the Quality dimension, with a Quality rank ahead of 92.71% of US stocks.
- The strongest trend for TSLA is in Growth, which has been heading down over the past 179 days.
- TSLA ranks lowest in Value; there it ranks in the 2nd percentile.
TSLA Stock Summary
- TESLA INC's market capitalization of $579,702,336,653 is ahead of 99.85% of US-listed equities.
- The price/operating cash flow metric for TESLA INC is higher than 91.09% of stocks in our set with a positive cash flow.
- With a year-over-year growth in debt of -44.39%, TESLA INC's debt growth rate surpasses just 6.72% of about US stocks.
- Stocks with similar financial metrics, market capitalization, and price volatility to TESLA INC are META, TSM, JNJ, LLY, and NVDA.
- TSLA's SEC filings can be seen here. And to visit TESLA INC's official web site, go to www.tesla.com.
TSLA Valuation Summary
- In comparison to the median Consumer Cyclical stock, TSLA's price/earnings ratio is 262.69% higher, now standing at 48.6.
- Over the past 157 months, TSLA's EV/EBIT ratio has gone up 84.2.
Below are key valuation metrics over time for TSLA.
Stock | Date | P/S | P/B | P/E | EV/EBIT |
---|---|---|---|---|---|
TSLA | 2023-05-19 | 6.6 | 11.9 | 48.6 | 43.0 |
TSLA | 2023-05-18 | 6.5 | 11.7 | 47.7 | 42.2 |
TSLA | 2023-05-17 | 6.4 | 11.5 | 46.9 | 41.5 |
TSLA | 2023-05-16 | 6.1 | 11.0 | 44.9 | 39.7 |
TSLA | 2023-05-15 | 6.1 | 11.0 | 44.9 | 39.7 |
TSLA | 2023-05-12 | 6.2 | 11.1 | 45.3 | 40.1 |
TSLA Growth Metrics
- Its 5 year net cashflow from operations growth rate is now at 4553.99%.
- Its year over year cash and equivalents growth rate is now at 2.12%.
- Its 2 year cash and equivalents growth rate is now at 116.65%.

The table below shows TSLA's growth in key financial areas (numbers in millions of US dollars).
Date | Revenue | Operating Cash Flow | Net Income to Common Stock |
---|---|---|---|
2022-12-31 | 81,462 | 14,724 | 12,556 |
2022-09-30 | 74,863 | 16,031 | 11,190 |
2022-06-30 | 67,166 | 14,078 | 9,516 |
2022-03-31 | 62,190 | 13,851 | 8,399 |
2021-12-31 | 53,823 | 11,497 | 5,519 |
2021-09-30 | 46,848 | 9,931 | 3,468 |
TSLA's Quality Factors
The “Quality” component of the POWR Ratings focuses on 31 different factors of a companies fundamentals and operational strength. Here are some key insights as we drill into the specifics of these quality attributes.- TSLA has a Quality Grade of B, ranking ahead of 83.53% of graded US stocks.
- TSLA's asset turnover comes in at 0.859 -- ranking 39th of 68 Automobiles and Trucks stocks.
- WKHS, IEP, and MPAA are the stocks whose asset turnover ratios are most correlated with TSLA.
The table below shows TSLA's key quality metrics over time.
Period | Asset Turnover | Gross Margin | ROIC |
---|---|---|---|
2021-09-30 | 0.859 | 0.231 | 0.145 |
2021-06-30 | 0.813 | 0.220 | 0.104 |
2021-03-31 | 0.761 | 0.212 | 0.071 |
2020-12-31 | 0.728 | 0.210 | 0.058 |
2020-09-30 | 0.725 | 0.211 | 0.048 |
2020-06-30 | 0.722 | 0.198 | 0.038 |
TSLA Price Target
For more insight on analysts targets of TSLA, see our TSLA price target page. And for a list of of all stocks sorted by upside potential based on analyst target price, see our Top Price Target page.
Average Price Target | $704.52 | Average Broker Recommendation | 1.84 (Hold) |
Tesla, Inc. (TSLA) Company Bio
Tesla Inc is a vertically integrated sustainable energy company and was founded in 2003. It designs, develops, manufactures, and sells high-performance fully electric vehicles and electric vehicle powertrain components. Tesla’s vehicle line up includes the Roadster, the Model S, the Model X, the Model 3, and the Tesla Semi, In 2019, Tesla introduced the Model Y, a mid-size SUV, with seating for up to seven, and Cybertruck. Tesla also manufactures a unique set of energy solutions, Powerwall, Powerpack, and Solar Roof, enabling homeowners, businesses, and utilities to manage renewable energy generation, storage, and consumption. The company has manufacturing facilities in Fremont, California and Gigafactory Shanghai. Elon Musk is the Chief Executive Officer, and the company has over 70,000 employees as of December, 2020.
Latest TSLA News From Around the Web
Below are the latest news stories about TESLA INC that investors may wish to consider to help them evaluate TSLA as an investment opportunity.
Most Active Equity Options For Midday - Tuesday, May 23Here are the most active equity options for midday. |
The Tesla-Killer Poised to Soar in 2023!It seems clear to us that Rivian is gaining significant traction in the EV race these days. |
The Best Battery Stock to Buy Now? PCRFY vs. HON vs. SLDAlthough the electrification of mobility draws much attention, investors may see better rewards with the best battery stocks to buy now. |
3 Undervalued Penny Stocks to Buy for Multi-Bagger ReturnsAre you after some great high-risk, high-return bargains? |
3 EV Stocks to Buy Before They Soar to New Heights in 2023These EV stocks to buy should help you boost your profits over the long-term in line with the fast-evolving EV revolution |
TSLA Price Returns
1-mo | 22.43% |
3-mo | -0.79% |
6-mo | 3.32% |
1-year | N/A |
3-year | 261.37% |
5-year | 959.74% |
YTD | 63.31% |
2022 | -65.03% |
2021 | 49.76% |
2020 | 743.44% |
2019 | 25.70% |
2018 | 6.89% |
Continue Researching TSLA
Here are a few links from around the web to help you further your research on Tesla Inc's stock as an investment opportunity:Tesla Inc (TSLA) Stock Price | Nasdaq
Tesla Inc (TSLA) Stock Quote, History and News - Yahoo Finance
Tesla Inc (TSLA) Stock Price and Basic Information | MarketWatch
Loading social stream, please wait...