TPG Specialty Lending, Inc. (TSLX): Price and Financial Metrics
GET POWR RATINGS... FREE!
TSLX POWR Grades
- Momentum is the dimension where TSLX ranks best; there it ranks ahead of 94.64% of US stocks.
- TSLX's strongest trending metric is Growth; it's been moving up over the last 177 days.
- TSLX's current lowest rank is in the Growth metric (where it is better than 23.81% of US stocks).
TSLX Stock Summary
- Of note is the ratio of SIXTH STREET SPECIALTY LENDING INC's sales and general administrative expense to its total operating expenses; 86.95% of US stocks have a lower such ratio.
- The ratio of debt to operating expenses for SIXTH STREET SPECIALTY LENDING INC is higher than it is for about 99.32% of US stocks.
- The volatility of SIXTH STREET SPECIALTY LENDING INC's share price is greater than that of only 8.64% US stocks with at least 200 days of trading history.
- If you're looking for stocks that are quantitatively similar to SIXTH STREET SPECIALTY LENDING INC, a group of peers worth examining would be SCM, SLRC, GLAD, FDUS, and CGBD.
- TSLX's SEC filings can be seen here. And to visit SIXTH STREET SPECIALTY LENDING INC's official web site, go to www.tpgspecialtylending.com.
TSLX Valuation Summary
- TSLX's EV/EBIT ratio is 19; this is 68.14% higher than that of the median Financial Services stock.
- TSLX's price/sales ratio has moved down 1.8 over the prior 108 months.
Below are key valuation metrics over time for TSLX.
Stock | Date | P/S | P/B | P/E | EV/EBIT |
---|---|---|---|---|---|
TSLX | 2023-02-03 | 5.4 | 1.2 | 15.0 | 19.0 |
TSLX | 2023-02-02 | 5.4 | 1.2 | 15.0 | 19.0 |
TSLX | 2023-02-01 | 5.4 | 1.2 | 15.0 | 19.0 |
TSLX | 2023-01-31 | 5.4 | 1.2 | 15.0 | 19.0 |
TSLX | 2023-01-30 | 5.4 | 1.2 | 14.9 | 18.9 |
TSLX | 2023-01-27 | 5.5 | 1.2 | 15.2 | 19.2 |
TSLX Growth Metrics
- The 3 year revenue growth rate now stands at 9.02%.
- Its 4 year price growth rate is now at -22.75%.
- Its 2 year net income to common stockholders growth rate is now at 212.43%.

The table below shows TSLX's growth in key financial areas (numbers in millions of US dollars).
Date | Revenue | Operating Cash Flow | Net Income to Common Stock |
---|---|---|---|
2022-09-30 | 287.48 | -352.281 | 103.609 |
2022-06-30 | 280.841 | 116.202 | 124.134 |
2022-03-31 | 279.781 | 109.451 | 196.013 |
2021-12-31 | 278.593 | 2.452 | 211.78 |
2021-09-30 | 262.488 | -68.045 | 223.442 |
2021-06-30 | 262.604 | -323.031 | 250.343 |
TSLX's Quality Factors
The “Quality” component of the POWR Ratings focuses on 31 different factors of a companies fundamentals and operational strength. Here are some key insights as we drill into the specifics of these quality attributes.- TSLX has a Quality Grade of C, ranking ahead of 48.58% of graded US stocks.
- TSLX's asset turnover comes in at 0.107 -- ranking 194th of 444 Trading stocks.
- SCU, DHIL, and IVZ are the stocks whose asset turnover ratios are most correlated with TSLX.
The table below shows TSLX's key quality metrics over time.
Period | Asset Turnover | Gross Margin | ROIC |
---|---|---|---|
2021-09-30 | 0.107 | 0.689 | 0.073 |
2021-06-30 | 0.111 | 0.708 | 0.084 |
2021-03-31 | 0.121 | 0.738 | 0.102 |
2020-12-31 | 0.126 | 0.759 | 0.072 |
2020-09-30 | 0.129 | 0.769 | 0.069 |
2020-06-30 | 0.129 | 0.771 | 0.054 |
TSLX Stock Price Chart Interactive Chart >
TSLX Price/Volume Stats
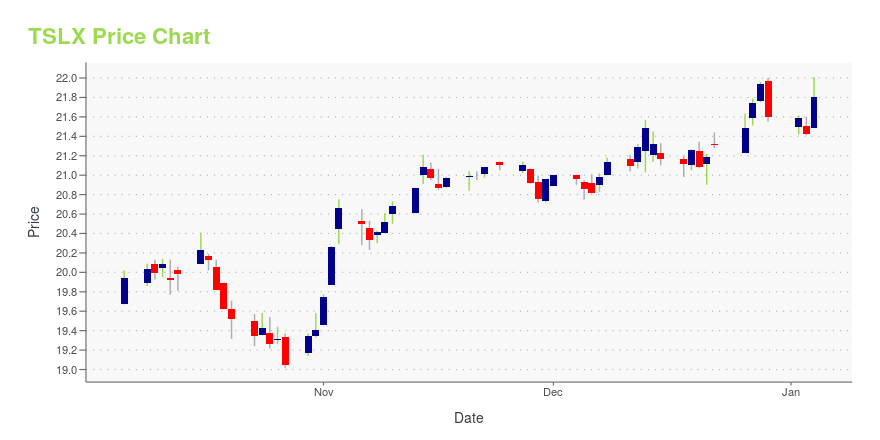
Current price | $19.00 | 52-week high | $24.27 |
Prev. close | $19.23 | 52-week low | $16.02 |
Day low | $18.94 | Volume | 328,900 |
Day high | $19.21 | Avg. volume | 308,663 |
50-day MA | $18.41 | Dividend yield | 9.47% |
200-day MA | $18.90 | Market Cap | 1.54B |
TPG Specialty Lending, Inc. (TSLX) Company Bio
TPG Specialty Lending is a specialty finance company focused on lending to middle-market companies, through direct originations of senior secured loans and, to a lesser extent, originations of mezzanine loans and investments in corporate bonds and equity securities. The company was founded in 1992 and is based in New York, New York.
Latest TSLX News From Around the Web
Below are the latest news stories about SIXTH STREET SPECIALTY LENDING INC that investors may wish to consider to help them evaluate TSLX as an investment opportunity.
Sixth Street Specialty Lending, Inc. Schedules Earnings Release and Conference Call to Discuss its Fourth Quarter and Fiscal Year Ended December 31, 2022 Financial ResultsNEW YORK, January 13, 2023--Sixth Street Specialty Lending, Inc. (NYSE: TSLX) ("TSLX" or "the Company") announced today that it will release its financial results for the fourth quarter and fiscal year ended December 31, 2022 on Thursday, February 16, 2023, after the market closes. TSLX invites all interested persons to its webcast / conference call on Friday, February 17, 2023 at 8:30 a.m. Eastern Time to discuss its fourth quarter and fiscal year ended December 31, 2022 financial results. |
Sixth Street: You Can Still Get A 10% Yield On Your Purchase (NYSE:TSLX)Sixth Street Specialty Lending has a record of achieving double-digit annual ROEs. Read more to see why I''m bullish on TSLX stock. |
Sixth Street Specialty Lending, Inc. 2022 Q3 - Results - Earnings Call Presentation (NYSE:TSLX)The following slide deck was published by Sixth Street Specialty Lending, Inc. |
Sixth Street Specialty Lending: A 10%-Yielding Gift For Investors (NYSE:TSLX)Sixth Street Specialty Lending is a well-managed BDC that is well-positioned to weather market volatility and generate solid returns for investors. Read why TSLX is a great pick. |
Sixth Street Specialty Lending, Inc. Reports Third Quarter 2022 Earnings Results; Declares a $0.03 Per Share Increase in Fourth Quarter Base Dividend Per Share to $0.45NEW YORK, November 01, 2022--Sixth Street Specialty Lending, Inc. (NYSE: TSLX, or the "Company") today reported financial results for the third quarter ended September 30, 2022. Please view a printable version of the 2022 Third Quarter Results. |
TSLX Price Returns
1-mo | 5.15% |
3-mo | 6.92% |
6-mo | 3.17% |
1-year | -12.78% |
3-year | 26.10% |
5-year | 80.26% |
YTD | 6.74% |
2022 | -16.37% |
2021 | 32.33% |
2020 | 9.77% |
2019 | 29.62% |
2018 | 0.36% |
TSLX Dividends
Ex-Dividend Date | Type | Payout Amount | Change | ||||||
---|---|---|---|---|---|---|---|---|---|
Loading, please wait... |
Continue Researching TSLX
Want to do more research on TPG Specialty Lending Inc's stock and its price? Try the links below:TPG Specialty Lending Inc (TSLX) Stock Price | Nasdaq
TPG Specialty Lending Inc (TSLX) Stock Quote, History and News - Yahoo Finance
TPG Specialty Lending Inc (TSLX) Stock Price and Basic Information | MarketWatch
Loading social stream, please wait...