
TuSimple Holdings Inc. (TSP): Price and Financial Metrics
TSP Price/Volume Stats
| Current price | $0.25 | 52-week high | $2.68 |
| Prev. close | $0.27 | 52-week low | $0.22 |
| Day low | $0.24 | Volume | 6,691,200 |
| Day high | $0.29 | Avg. volume | 7,073,004 |
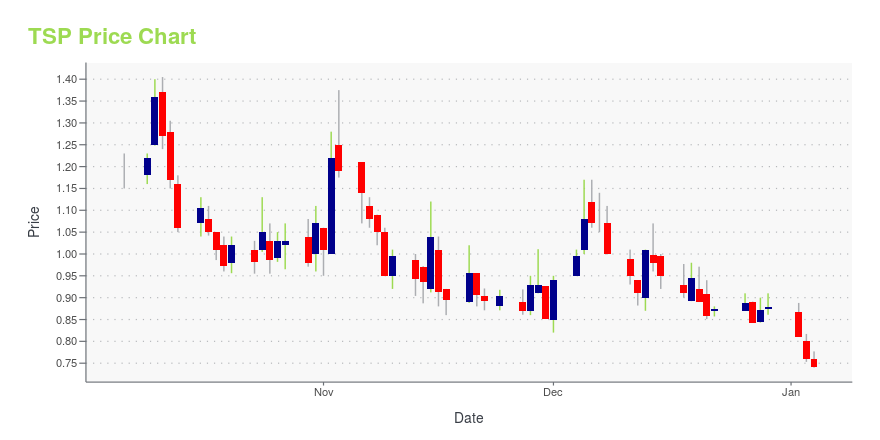
| 50-day MA | $0.72 | Dividend yield | N/A |
| 200-day MA | $1.35 | Market Cap | 57.47M |
TSP Stock Price Chart Interactive Chart >
TuSimple Holdings Inc. (TSP) Company Bio
TuSimple Holdings Inc., an autonomous technology company, develops autonomous technology specifically designed for semi-trucks in the United States and internationally. It intends to produce a line of purpose-built (Level 4) L4 autonomous semi-trucks for the North American market. The company operates its Autonomous Freight Network (AFN) L4 autonomous semi-trucks equipped with its autonomous driving technology. Its AFN is an ecosystem that consists of L4 autonomous semi-trucks, high definition digital mapped routes, terminals, and TuSimple Connect, a cloud-based autonomous operations oversight system. The company was founded in 2015 and is based in San Diego, California.
Latest TSP News From Around the Web
Below are the latest news stories about TUSIMPLE HOLDINGS INC that investors may wish to consider to help them evaluate TSP as an investment opportunity.
Autonomous trucking 2023: Leaders emerge amid exits and entriesThree companies departed autonomous trucking in 2023 as Aurora Innovation, Kodiak Robotics and Torc Robotics staked leadership claims. The post Autonomous trucking 2023: Leaders emerge amid exits and entries appeared first on FreightWaves. |
Autonomous trucking company TuSimple to cease US operations amid new round of lay-offs, focus on Asia-Pacific businessAutonomous trucking company TuSimple Holdings is set to wind down its operations in the United States amid plans to cut 75 per cent of its remaining workforce in the country, according to the Nasdaq-listed firm's latest filing. TuSimple's board of directors approved a new round lay-offs that will affect around 150 employees, or 19 per cent of its global workforce, as part of its restructuring initiative, the company said in a filing with the US Securities and Exchange Commission (SEC) on Monday. |
TuSimple’s Cutting More Jobs. Why It’s More Gloom for the Self-Driving Truck Start-Up.Restructuring plans can be beneficial for companies and investors but three in the space of a year is never a good sign. |
TuSimple Winds Down U.S. Operations as It Looks for BuyerSelf-driving trucking company TuSimple Holdings said Monday that it is winding down its U.S. business, reducing its workforce to about 30 people as it looks for a buyer for its assets that remain in the country. The demise of TuSimple’s U.S. operations marks a precipitous fall for the one-time leader in autonomous long-haul trucking. TuSimple is now moving its business to China, according to company filings. |
TuSimple lays off 150 more employees as it winds down US operationsTuSimple Holdings is following through on winding down its U.S. autonomous trucking business, laying off 150 more employees. The post TuSimple lays off 150 more employees as it winds down US operations appeared first on FreightWaves. |
TSP Price Returns
| 1-mo | N/A |
| 3-mo | N/A |
| 6-mo | -31.62% |
| 1-year | -87.56% |
| 3-year | -99.37% |
| 5-year | N/A |
| YTD | -71.52% |
| 2023 | -46.48% |
| 2022 | -95.43% |
| 2021 | N/A |
| 2020 | N/A |
| 2019 | N/A |
Loading social stream, please wait...