
TSR, Inc. (TSRI): Price and Financial Metrics
TSRI Price/Volume Stats
| Current price | $13.38 | 52-week high | $13.40 |
| Prev. close | $13.37 | 52-week low | $6.33 |
| Day low | $13.38 | Volume | 2,400 |
| Day high | $13.40 | Avg. volume | 6,850 |
| 50-day MA | $11.03 | Dividend yield | N/A |
| 200-day MA | $9.09 | Market Cap | 29.03M |
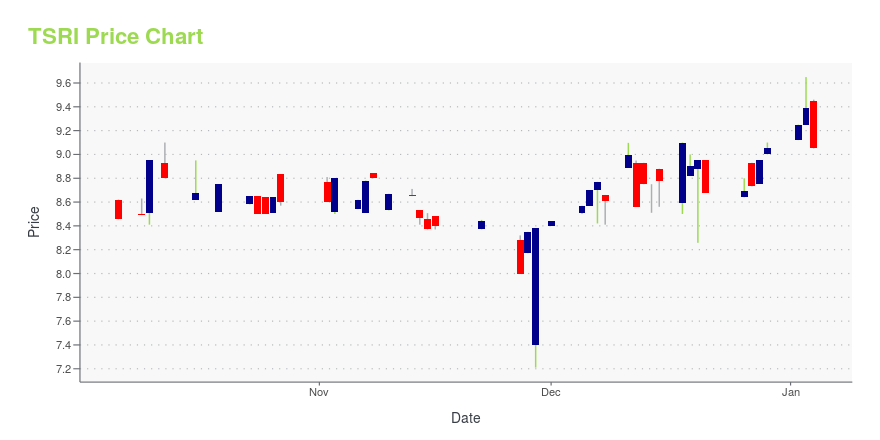
TSRI Stock Price Chart Interactive Chart >
Latest TSRI News From Around the Web
Below are the latest news stories about TSR INC that investors may wish to consider to help them evaluate TSRI as an investment opportunity.
TSR, Inc.'s (NASDAQ:TSRI) Stock Is Going Strong: Is the Market Following Fundamentals?TSR's (NASDAQ:TSRI) stock is up by a considerable 22% over the past three months. Since the market usually pay for a... |
Here's Why TSR (NASDAQ:TSRI) Has Caught The Eye Of InvestorsInvestors are often guided by the idea of discovering 'the next big thing', even if that means buying 'story stocks... |
TSR, Inc. Reports Results for the First Quarter Ended August 31, 2023HAUPPAUGE, N.Y., October 11, 2023--TSR, Inc. (Nasdaq: TSRI) ("TSR" or "The Company"), a provider of information technology consulting and recruiting services, today announced its financial results for the first quarter ended August 31, 2023. |
TSR, Inc. Board of Directors Announces Exploration of Strategic AlternativesHAUPPAUGE, N.Y., August 28, 2023--TSR, Inc. (Nasdaq: TSRI) ("TSR" or the "Company"), a provider of information technology consulting and recruiting services, today announced that its Board of Directors has initiated a process to identify and evaluate potential strategic alternatives to maximize shareholder value. The Company expects to consider a range of options, which may include a sale of or acquisitions by the Company or a special dividend, as well as other potential alternatives. The Compan |
TSR, Inc. Reports Results for the Fiscal Year and Fourth Quarter Ended May 31, 2023HAUPPAUGE, N.Y., August 11, 2023--TSR, Inc. (Nasdaq: TSRI) ("TSR" or "The Company"), a provider of information technology consulting and recruiting services, today announced financial results for the fiscal year and fourth quarter ended May 31, 2023. |
TSRI Price Returns
| 1-mo | 0.15% |
| 3-mo | 74.90% |
| 6-mo | 52.91% |
| 1-year | 82.29% |
| 3-year | 29.84% |
| 5-year | 188.36% |
| YTD | 47.76% |
| 2023 | 30.48% |
| 2022 | -23.74% |
| 2021 | 30.00% |
| 2020 | 95.09% |
| 2019 | -22.84% |
Continue Researching TSRI
Want to see what other sources are saying about Tsr Inc's financials and stock price? Try the links below:Tsr Inc (TSRI) Stock Price | Nasdaq
Tsr Inc (TSRI) Stock Quote, History and News - Yahoo Finance
Tsr Inc (TSRI) Stock Price and Basic Information | MarketWatch
Loading social stream, please wait...