TotalEnergies SE ADR (TTE): Price and Financial Metrics

TotalEnergies SE ADR (TTE): $64.62

1.14 (-1.73%)

POWR Rating

Component Grades

Momentum

A

Stability

B

Sentiment

Quality

B

Add TTE to Watchlist
Sign Up

Industry: Energy - Oil & Gas

Industry

D

Ranked

#12 of 89

in industry

TTE Price/Volume Stats

Current price $64.62 52-week high $67.33
Prev. close $65.76 52-week low $47.84
Day low $64.31 Volume 1,394,500
Day high $66.05 Avg. volume 1,477,905
50-day MA $63.04 Dividend yield 4.71%
200-day MA $61.33 Market Cap 158.61B

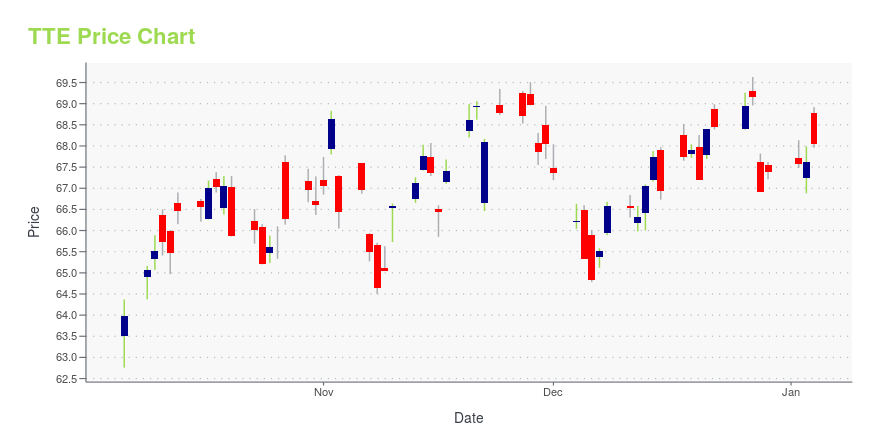
TTE Stock Price Chart Interactive Chart >

TTE POWR Grades

  • TTE scores best on the Momentum dimension, with a Momentum rank ahead of 95.91% of US stocks.
  • TTE's strongest trending metric is Stability; it's been moving up over the last 26 weeks.
  • TTE's current lowest rank is in the Growth metric (where it is better than 47.61% of US stocks).

TTE Stock Summary

  • TOTALENERGIES SE's market capitalization of $147,692,813,161 is ahead of 98.75% of US-listed equities.
  • Of note is the ratio of TOTALENERGIES SE's sales and general administrative expense to its total operating expenses; just 0.33% of US stocks have a lower such ratio.
  • Revenue growth over the past 12 months for TOTALENERGIES SE comes in at 83.61%, a number that bests 92.29% of the US stocks we're tracking.
  • Stocks with similar financial metrics, market capitalization, and price volatility to TOTALENERGIES SE are BHP, COP, NEE, SBUX, and LIN.
  • Visit TTE's SEC page to see the company's official filings. To visit the company's web site, go to www.total.com.

TTE Valuation Summary

  • TTE's price/earnings ratio is 4.7; this is 34.72% lower than that of the median Energy stock.
  • TTE's price/sales ratio has moved down 0.6 over the prior 243 months.

Below are key valuation metrics over time for TTE.

Stock Date P/S P/B P/E EV/EBIT
TTE 2023-07-07 0.4 1.3 4.7 2.7
TTE 2023-07-06 0.4 1.3 4.7 2.7
TTE 2023-07-05 0.4 1.3 4.8 2.8
TTE 2023-07-03 0.4 1.3 4.9 2.8
TTE 2023-06-30 0.4 1.3 4.9 2.8
TTE 2023-06-29 0.4 1.3 4.8 2.8

TTE Growth Metrics

    The 3 year price growth rate now stands at -9.99%.
  • Its year over year net income to common stockholders growth rate is now at 548.42%.
  • Its 2 year net income to common stockholders growth rate is now at 115.29%.
TTE's revenue has moved up $137,055,000,000 over the prior 21 months.

The table below shows TTE's growth in key financial areas (numbers in millions of US dollars).

Date Revenue Operating Cash Flow Net Income to Common Stock
2022-12-31 256,815 38,700 19,778
2022-09-30 177,715 52,320 16,659
2022-06-30 232,268 32,495 20,370
2022-03-31 209,951 32,429 17,632
2021-12-31 184,634 30,410 16,032
2021-09-30 161,684 24,463 11,086

TTE's Quality Factors

The “Quality” component of the POWR Ratings focuses on 31 different factors of a companies fundamentals and operational strength. Here are some key insights as we drill into the specifics of these quality attributes.
  • TTE has a Quality Grade of C, ranking ahead of 65.47% of graded US stocks.
  • TTE's asset turnover comes in at 0.444 -- ranking 58th of 137 Petroleum and Natural Gas stocks.
  • 500 - Internal server error

The table below shows TTE's key quality metrics over time.

Period Asset Turnover Gross Margin ROIC
2020-12-31 0.444 0.353 -0.023
2019-12-31 0.665 0.341 0.098
2019-12-31 0.665 0.341 0.098
2018-12-31 0.737 0.317 0.104
2018-12-31 0.737 0.317 0.104
2017-12-31 0.630 0.333 0.068

TotalEnergies SE ADR (TTE) Company Bio


TotalEnergies SE is a French multinational integrated oil and gas company founded in 1924 and one of the seven "supermajor" oil companies. Its businesses cover the entire oil and gas chain, from crude oil and natural gas exploration and production to power generation, transportation, refining, petroleum product marketing, and international crude oil and product trading. TotalEnergies is also a large-scale chemicals manufacturer.


TTE Latest News Stream


Event/Time News Detail
Loading, please wait...

TTE Latest Social Stream


Loading social stream, please wait...

View Full TTE Social Stream

Latest TTE News From Around the Web

Below are the latest news stories about TOTALENERGIES SE that investors may wish to consider to help them evaluate TTE as an investment opportunity.

Energy & Utilities Roundup: Market Talk

Find insight on rig-count data from Enverus, Saudi Arabia’s national oil company Aramco, natural-gas prices, and more in the latest Market Talks covering Energy and Utilities.

Yahoo | September 28, 2023

France: TotalEnergies Acquires Ombrea and Creates a Center of Expertise for Agrivoltaics

PARIS, September 28, 2023--Regulatory News: TotalEnergies (Paris:TTE) (LSE:TTE) (NYSE:TTE) has finalized the acquisition of France’s agrivoltaics leader Ombrea.

Yahoo | September 28, 2023

Angola: TotalEnergies Sells a 40% Interest in Block 20 to Petronas Ahead of Its Development

PARIS, September 28, 2023-- TotalEnergies SE (Paris:TTE) (LSE:TTE) (NYSE:TTE):

Yahoo | September 28, 2023

Germany: TotalEnergies will install and operate 1,100 High-Power EV Charge points

PARIS, September 27, 2023-- TotalEnergies (Paris:TTE) (LSE:TTE) (NYSE:TTE) has been awarded a contract for the installation and operation of 1100 high-power charge points (HPC) for electrical vehicles (up to 200 kW) as part of the German government's tender for the "Deutschlandnetz" ("Germany network"). These charging points will be grouped in "EV hubs" at 134 locations in eastern, central and western Germany. These new charge points will entirely be supplied with renewable electricity.

Yahoo | September 27, 2023

TotalEnergies: Strategy & Outlook Presentation 2023

NEW YORK, September 27, 2023--Regulatory News: Patrick Pouyanné, Chairman and CEO, and the members of the Executive Committee will present TotalEnergies’ (Paris:TTE) (LSE:TTE) (NYSE:TTE) Strategy & Outlook in New York today. The webcast of the presentation in English is available on totalenergies.com.

Yahoo | September 27, 2023

Read More 'TTE' Stories Here

TTE Price Returns

1-mo 2.37%
3-mo 14.13%
6-mo 5.20%
1-year 38.39%
3-year 123.58%
5-year 28.80%
YTD 7.46%
2022 32.03%
2021 23.64%
2020 -18.19%
2019 9.53%
2018 -1.19%

TTE Dividends

Ex-Dividend Date Type Payout Amount Change
Loading, please wait...
View Full TTE Dividend History

Get Free Updates

Join thousands of investors who get the latest news, insights and top rated picks from StockNews.com!