TTEC Holdings, Inc. (TTEC): Price and Financial Metrics
TTEC Price/Volume Stats
Current price | $10.37 | 52-week high | $38.09 |
Prev. close | $10.40 | 52-week low | $9.44 |
Day low | $10.34 | Volume | 1,040,100 |
Day high | $10.90 | Avg. volume | 303,938 |
50-day MA | $15.98 | Dividend yield | 10.52% |
200-day MA | $23.42 | Market Cap | 491.83M |
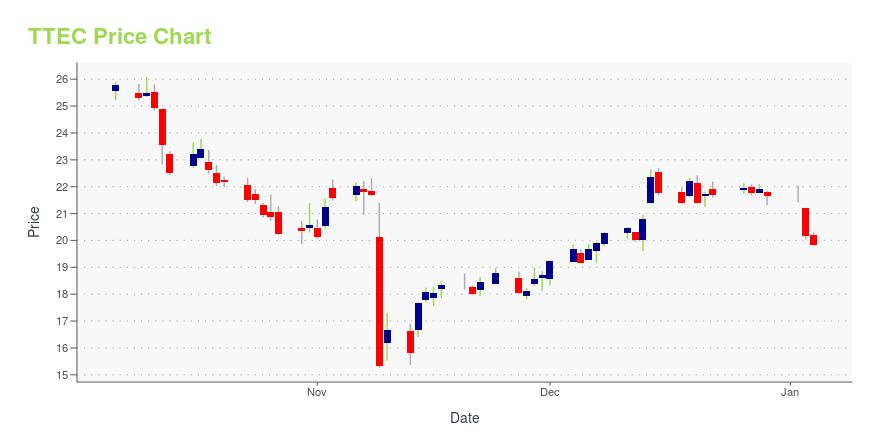
TTEC Stock Price Chart Interactive Chart >
TTEC POWR Grades
- Value is the dimension where TTEC ranks best; there it ranks ahead of 93.65% of US stocks.
- The strongest trend for TTEC is in Stability, which has been heading down over the past 26 weeks.
- TTEC's current lowest rank is in the Growth metric (where it is better than 7.37% of US stocks).
TTEC Stock Summary
- The capital turnover (annual revenue relative to shareholder's equity) for TTEC is 4.26 -- better than 88.31% of US stocks.
- With a price/sales ratio of 0.38, TTEC HOLDINGS INC has a higher such ratio than merely 12.46% of stocks in our set.
- The volatility of TTEC HOLDINGS INC's share price is greater than that of 75.42% US stocks with at least 200 days of trading history.
- Stocks with similar financial metrics, market capitalization, and price volatility to TTEC HOLDINGS INC are ACEL, DY, SLVM, VRTS, and SHO.
- TTEC's SEC filings can be seen here. And to visit TTEC HOLDINGS INC's official web site, go to www.ttec.com.
TTEC Valuation Summary
- TTEC's EV/EBIT ratio is 13.7; this is 35.38% lower than that of the median Technology stock.
- Over the past 243 months, TTEC's price/sales ratio has gone down 0.4.
Below are key valuation metrics over time for TTEC.
Stock | Date | P/S | P/B | P/E | EV/EBIT |
---|---|---|---|---|---|
TTEC | 2023-12-08 | 0.4 | 1.6 | 23.6 | 13.7 |
TTEC | 2023-12-07 | 0.4 | 1.6 | 23.2 | 13.5 |
TTEC | 2023-12-06 | 0.4 | 1.6 | 22.9 | 13.5 |
TTEC | 2023-12-05 | 0.4 | 1.6 | 22.3 | 13.3 |
TTEC | 2023-12-04 | 0.4 | 1.6 | 23.0 | 13.5 |
TTEC | 2023-12-01 | 0.4 | 1.6 | 22.4 | 13.3 |
TTEC Growth Metrics
- Its 5 year net cashflow from operations growth rate is now at 28.55%.
- Its 5 year price growth rate is now at 16.7%.
- The 2 year cash and equivalents growth rate now stands at -69.86%.
The table below shows TTEC's growth in key financial areas (numbers in millions of US dollars).
Date | Revenue | Operating Cash Flow | Net Income to Common Stock |
---|---|---|---|
2022-09-30 | 2,397.744 | 195.047 | 109.635 |
2022-06-30 | 2,372.025 | 209.729 | 101.821 |
2022-03-31 | 2,322.569 | 195.195 | 123.956 |
2021-12-31 | 2,273.062 | 251.296 | 140.97 |
2021-09-30 | 2,231.721 | 260.198 | 156.645 |
2021-06-30 | 2,157.967 | 299.481 | 163.576 |
TTEC's Quality Factors
The “Quality” component of the POWR Ratings focuses on 31 different factors of a companies fundamentals and operational strength. Here are some key insights as we drill into the specifics of these quality attributes.- TTEC has a Quality Grade of C, ranking ahead of 55.27% of graded US stocks.
- TTEC's asset turnover comes in at 1.323 -- ranking 68th of 563 Business Services stocks.
- TBI, QUAD, and CMPR are the stocks whose asset turnover ratios are most correlated with TTEC.
The table below shows TTEC's key quality metrics over time.
Period | Asset Turnover | Gross Margin | ROIC |
---|---|---|---|
2021-06-30 | 1.323 | 0.267 | 0.201 |
2021-03-31 | 1.315 | 0.261 | 0.188 |
2020-12-31 | 1.195 | 0.255 | 0.151 |
2020-09-30 | 1.152 | 0.254 | 0.137 |
2020-06-30 | 1.144 | 0.249 | 0.136 |
2020-03-31 | 1.222 | 0.244 | 0.131 |
TTEC Price Target
For more insight on analysts targets of TTEC, see our TTEC price target page. And for a list of of all stocks sorted by upside potential based on analyst target price, see our Top Price Target page.
Average Price Target | $116.57 | Average Broker Recommendation | 1.5 (Moderate Buy) |
TTEC Holdings, Inc. (TTEC) Company Bio
TeleTech Holdings is a customer engagement management service provider that delivers integrated consulting, technology, growth and customer care solutions on a global scale. The company was founded in 1982 and is based in Englewood, Colorado.
Latest TTEC News From Around the Web
Below are the latest news stories about TTEC HOLDINGS INC that investors may wish to consider to help them evaluate TTEC as an investment opportunity.
TTEC AI Readiness Assessment Identifies Four Critical Competencies Required to Unlock the Full Potential of an AI-enabled Contact CenterTTEC Holdings Inc. (NASDAQ: TTEC), a leading global CX (customer experience) technology and services innovator for AI-enabled CX with solutions from TTEC Engage and TTEC Digital, today announced the results of its inaugural AI Readiness Assessment. The survey findings indicate that the enthusiasm over generative AI has transitioned to demand for practical technology and services solutions that can scale from use cases to full-scale production. |
TTEC Holdings, Inc.'s (NASDAQ:TTEC) Intrinsic Value Is Potentially 23% Below Its Share PriceKey Insights Using the 2 Stage Free Cash Flow to Equity, TTEC Holdings fair value estimate is US$16.06 TTEC Holdings is... |
Tech Stocks Are Poised to Soar Amid Digital Transformation, According to Canaccord — Here Are 2 Names With at Least 40% Upside PotentialIs digital technology coming of age? Over the past several years, we have seen recurring demand waves for digital tech, all billed as transformative. A new one is starting now, a digital transformation that brings with it the promise of true change. Previous waves had been focused on company internals – but the current growing demand for digital transformation is occurring on the outside, facing the customers. This is a new development, and it brings with it potential for a lasting change in the |
TTEC wins Talent Acquisition Team of the Year at OnCon Icon AwardsTTEC Holdings Inc. (NASDAQ: TTEC), a leading global CX (customer experience) technology and services innovator for AI-enabled CX with solutions from TTEC Engage and TTEC Digital, today announced that it won Talent Acquisition Team of the Year at the OnCon Icon Awards 2023. |
TTEC recognized as one of the World's Top Companies for Women 2023 by ForbesTTEC Holdings Inc. (NASDAQ:TTEC), a leading global CX (customer experience) technology and services innovator for AI-enabled CX with solutions from TTEC Engage and TTEC Digital, today announced that it was recognized on the Forbes list of the World's Top Companies for Women 2023. |
TTEC Price Returns
1-mo | -42.52% |
3-mo | -52.15% |
6-mo | -59.56% |
1-year | -70.70% |
3-year | -88.65% |
5-year | -67.95% |
YTD | -52.15% |
2023 | -49.06% |
2022 | -50.44% |
2021 | 25.33% |
2020 | 92.31% |
2019 | 40.78% |
TTEC Dividends
Ex-Dividend Date | Type | Payout Amount | Change | ||||||
---|---|---|---|---|---|---|---|---|---|
Loading, please wait... |
Continue Researching TTEC
Here are a few links from around the web to help you further your research on TTEC Holdings Inc's stock as an investment opportunity:TTEC Holdings Inc (TTEC) Stock Price | Nasdaq
TTEC Holdings Inc (TTEC) Stock Quote, History and News - Yahoo Finance
TTEC Holdings Inc (TTEC) Stock Price and Basic Information | MarketWatch
Loading social stream, please wait...