Tetra Technologies, Inc. (TTI): Price and Financial Metrics

Tetra Technologies, Inc. (TTI): $4.20

0.07 (-1.64%)

POWR Rating

Component Grades

Momentum

B

Stability

C

Sentiment

Quality

C

Add TTI to Watchlist
Sign Up

Industry: Energy - Services

Industry

C

Ranked

#28 of 50

in industry

TTI Price/Volume Stats
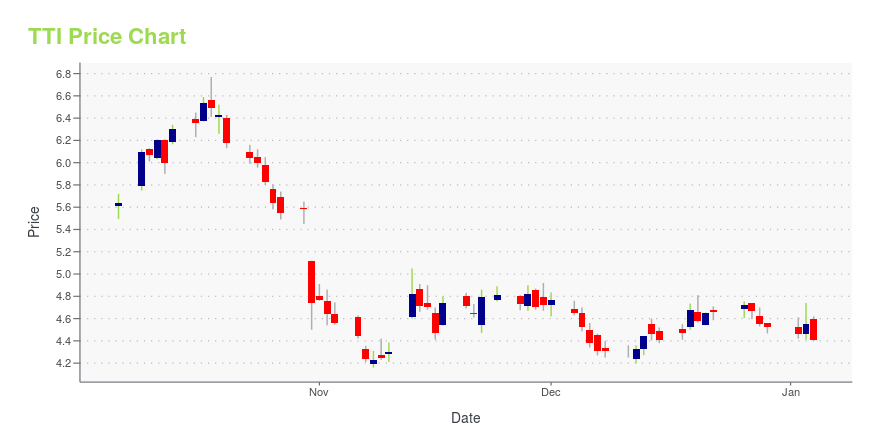
Current price $4.20 52-week high $6.77
Prev. close $4.27 52-week low $2.43
Day low $4.16 Volume 935,200
Day high $4.27 Avg. volume 1,473,125
50-day MA $4.09 Dividend yield N/A
200-day MA $4.61 Market Cap 547.74M

TTI Stock Price Chart Interactive Chart >

TTI POWR Grades

  • TTI scores best on the Growth dimension, with a Growth rank ahead of 95.73% of US stocks.
  • TTI's strongest trending metric is Sentiment; it's been moving down over the last 26 weeks.
  • TTI's current lowest rank is in the Stability metric (where it is better than 16.61% of US stocks).

TTI Stock Summary

  • The capital turnover (annual revenue relative to shareholder's equity) for TTI is 4.36 -- better than 88.7% of US stocks.
  • TTI's went public 33.78 years ago, making it older than 84.63% of listed US stocks we're tracking.
  • Over the past twelve months, TTI has reported earnings growth of 110.82%, putting it ahead of 90.29% of US stocks in our set.
  • If you're looking for stocks that are quantitatively similar to TETRA TECHNOLOGIES INC, a group of peers worth examining would be OEC, REZI, EPC, ARTW, and TNC.
  • Visit TTI's SEC page to see the company's official filings. To visit the company's web site, go to www.tetratec.com.

TTI Valuation Summary

  • TTI's price/sales ratio is 1; this is 37.5% lower than that of the median Energy stock.
  • Over the past 243 months, TTI's price/earnings ratio has gone down 12.3.

Below are key valuation metrics over time for TTI.

Stock Date P/S P/B P/E EV/EBIT
TTI 2023-12-28 1 4.2 21.3 13.5
TTI 2023-12-27 1 4.3 21.9 13.8
TTI 2023-12-26 1 4.3 22.1 13.9
TTI 2023-12-22 1 4.3 21.8 13.8
TTI 2023-12-21 1 4.2 21.8 13.8
TTI 2023-12-20 1 4.2 21.5 13.6

TTI Growth Metrics

    Its 3 year net cashflow from operations growth rate is now at -94.41%.
  • Its 4 year price growth rate is now at -86.94%.
  • The 2 year cash and equivalents growth rate now stands at 11.26%.
TTI's revenue has moved down $425,035,000 over the prior 49 months.

The table below shows TTI's growth in key financial areas (numbers in millions of US dollars).

Date Revenue Operating Cash Flow Net Income to Common Stock
2022-09-30 518.913 20.181 8.602
2022-06-30 479.375 20.853 10.837
2022-03-31 440.985 4.766 2.339
2021-12-31 388.272 4.657 103.333
2021-09-30 84.855 22.509 89.439
2021-06-30 141.982 24.132 73.624

TTI's Quality Factors

The “Quality” component of the POWR Ratings focuses on 31 different factors of a companies fundamentals and operational strength. Here are some key insights as we drill into the specifics of these quality attributes.
  • TTI has a Quality Grade of C, ranking ahead of 34.49% of graded US stocks.
  • TTI's asset turnover comes in at 0.143 -- ranking 122nd of 137 Petroleum and Natural Gas stocks.
  • DWSN, MCF, and HP are the stocks whose asset turnover ratios are most correlated with TTI.

The table below shows TTI's key quality metrics over time.

Period Asset Turnover Gross Margin ROIC
2021-09-30 0.143 0.329 0.153
2021-06-30 0.182 0.226 0.084
2021-03-31 0.239 0.155 0.058
2020-12-31 0.318 0.179 -0.020
2020-09-30 0.677 0.051 -0.040
2020-06-30 0.716 0.073 -0.040

TTI Price Target

For more insight on analysts targets of TTI, see our TTI price target page. And for a list of of all stocks sorted by upside potential based on analyst target price, see our Top Price Target page.

Average Price Target $4.25 Average Broker Recommendation 1.25 (Strong Buy)

Tetra Technologies, Inc. (TTI) Company Bio


Tetra Technologies operates as a diversified oil and gas services company. It operates through four divisions: Fluids, Production Testing, Compression, and Offshore. The company was founded in 1981 and is based in The Woodlands, Texas.


TTI Latest News Stream


Event/Time News Detail
Loading, please wait...

TTI Latest Social Stream


Loading social stream, please wait...

View Full TTI Social Stream

Latest TTI News From Around the Web

Below are the latest news stories about TETRA TECHNOLOGIES INC that investors may wish to consider to help them evaluate TTI as an investment opportunity.

Hedge Funds Say These Penny Stocks Are Poised to Explode

In this article, we will take a detailed look at hedge funds say these penny stocks are poised to explode. To see more such stocks, click Hedge Funds Say These 5 Penny Stocks are Poised to Explode. Despite common belief, not all penny stocks are inherently risky and suitable only for short-term gains. Some penny stocks […]

Yahoo | December 19, 2023

TETRA Technologies (NYSE:TTI) Shareholders Will Want The ROCE Trajectory To Continue

If we want to find a potential multi-bagger, often there are underlying trends that can provide clues. One common...

Yahoo | December 19, 2023

Investors in TETRA Technologies (NYSE:TTI) have seen incredible returns of 440% over the past three years

While TETRA Technologies, Inc. ( NYSE:TTI ) shareholders are probably generally happy, the stock hasn't had...

Yahoo | December 5, 2023

Do Options Traders Know Something About TETRA Technologies (TTI) Stock We Don't?

Investors need to pay close attention to TETRA Technologies (TTI) stock based on the movements in the options market lately.

Yahoo | November 24, 2023

With 72% ownership of the shares, TETRA Technologies, Inc. (NYSE:TTI) is heavily dominated by institutional owners

Key Insights Significantly high institutional ownership implies TETRA Technologies' stock price is sensitive to their...

Yahoo | November 21, 2023

Read More 'TTI' Stories Here

TTI Price Returns

1-mo 6.60%
3-mo -8.30%
6-mo -31.37%
1-year 66.01%
3-year 41.89%
5-year 70.04%
YTD -7.08%
2023 30.64%
2022 21.83%
2021 229.66%
2020 -56.05%
2019 16.67%

Get Free Updates

Join thousands of investors who get the latest news, insights and top rated picks from StockNews.com!