The Tile Shop Holdings, Inc. (TTSH): Price and Financial Metrics
TTSH Price/Volume Stats
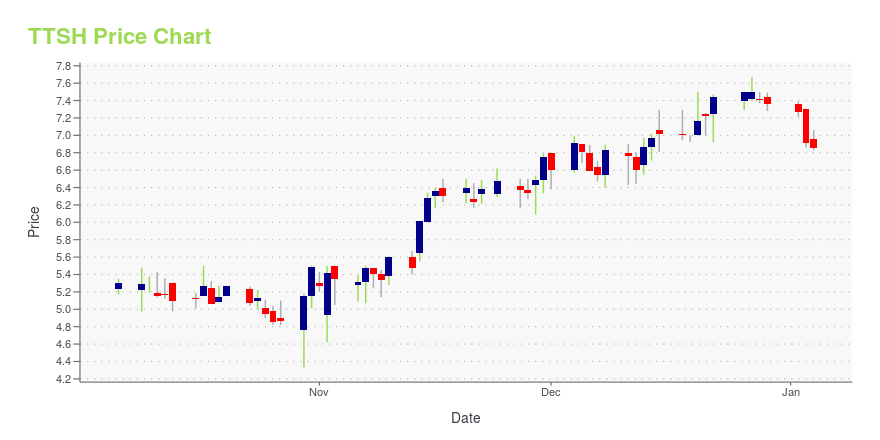
Current price | $6.81 | 52-week high | $6.99 |
Prev. close | $6.91 | 52-week low | $3.91 |
Day low | $6.68 | Volume | 32,100 |
Day high | $6.90 | Avg. volume | 82,725 |
50-day MA | $5.63 | Dividend yield | N/A |
200-day MA | $5.35 | Market Cap | 303.26M |
TTSH Stock Price Chart Interactive Chart >
TTSH POWR Grades
- Quality is the dimension where TTSH ranks best; there it ranks ahead of 95.99% of US stocks.
- The strongest trend for TTSH is in Growth, which has been heading down over the past 177 days.
- TTSH ranks lowest in Growth; there it ranks in the 25th percentile.
TTSH Stock Summary
- TILE SHOP HOLDINGS INC's capital turnover -- a measure of revenue relative to shareholder's equity -- is better than 83.27% of US listed stocks.
- Of note is the ratio of TILE SHOP HOLDINGS INC's sales and general administrative expense to its total operating expenses; 87.28% of US stocks have a lower such ratio.
- Shareholder yield, a measure of how much is returned to shareholders via dividends and share repurchases, for TTSH comes in at 11.92% -- higher than that of 85.03% of stocks in our set.
- Stocks with similar financial metrics, market capitalization, and price volatility to TILE SHOP HOLDINGS INC are GIC, BSET, BGFV, SAMG, and PAHC.
- TTSH's SEC filings can be seen here. And to visit TILE SHOP HOLDINGS INC's official web site, go to www.tileshop.com.
TTSH Valuation Summary
- TTSH's price/earnings ratio is 27; this is 67.7% higher than that of the median Consumer Cyclical stock.
- TTSH's price/sales ratio has moved down 2.5 over the prior 135 months.
Below are key valuation metrics over time for TTSH.
Stock | Date | P/S | P/B | P/E | EV/EBIT |
---|---|---|---|---|---|
TTSH | 2023-12-01 | 0.8 | 2.5 | 27.0 | 24.2 |
TTSH | 2023-11-30 | 0.8 | 2.5 | 27.6 | 24.6 |
TTSH | 2023-11-29 | 0.8 | 2.4 | 26.5 | 23.9 |
TTSH | 2023-11-28 | 0.7 | 2.4 | 25.9 | 23.5 |
TTSH | 2023-11-27 | 0.7 | 2.4 | 26.1 | 23.6 |
TTSH | 2023-11-24 | 0.8 | 2.4 | 26.5 | 23.8 |
TTSH Growth Metrics
- Its 3 year price growth rate is now at 14.16%.
- The 4 year price growth rate now stands at -95.21%.
- Its 2 year cash and equivalents growth rate is now at 116.54%.

The table below shows TTSH's growth in key financial areas (numbers in millions of US dollars).
Date | Revenue | Operating Cash Flow | Net Income to Common Stock |
---|---|---|---|
2022-09-30 | 397.412 | 2.486 | 16.058 |
2022-06-30 | 392.498 | 6.929 | 14.41 |
2022-03-31 | 381.087 | 17.211 | 12.99 |
2021-12-31 | 370.7 | 39.691 | 14.774 |
2021-09-30 | 362.073 | 52.639 | 14.341 |
2021-06-30 | 351.325 | 66.593 | 14.08 |
TTSH's Quality Factors
The “Quality” component of the POWR Ratings focuses on 31 different factors of a companies fundamentals and operational strength. Here are some key insights as we drill into the specifics of these quality attributes.- TTSH has a Quality Grade of A, ranking ahead of 99.03% of graded US stocks.
- TTSH's asset turnover comes in at 1.024 -- ranking 134th of 165 Retail stocks.
- GCO, BGFV, and WMT are the stocks whose asset turnover ratios are most correlated with TTSH.
The table below shows TTSH's key quality metrics over time.
Period | Asset Turnover | Gross Margin | ROIC |
---|---|---|---|
2021-09-30 | 1.024 | 0.689 | 0.054 |
2021-06-30 | 0.990 | 0.688 | 0.051 |
2021-03-31 | 0.900 | 0.684 | 0.026 |
2020-12-31 | 0.893 | 0.681 | 0.014 |
2020-09-30 | 0.851 | 0.681 | -0.002 |
2020-06-30 | 0.837 | 0.684 | -0.008 |
The Tile Shop Holdings, Inc. (TTSH) Company Bio
The Tile Shop Holdings, Inc. operates as a specialty retailer of manufactured and natural stone tiles, setting and maintenance materials, and related accessories in the United States.
Latest TTSH News From Around the Web
Below are the latest news stories about TILE SHOP HOLDINGS INC that investors may wish to consider to help them evaluate TTSH as an investment opportunity.
The Returns At Tile Shop Holdings (NASDAQ:TTSH) Aren't GrowingIf we want to find a stock that could multiply over the long term, what are the underlying trends we should look for... |
Tile Shop Holdings, Inc. (NASDAQ:TTSH) Q3 2023 Earnings Call TranscriptTile Shop Holdings, Inc. (NASDAQ:TTSH) Q3 2023 Earnings Call Transcript November 5, 2023 Operator: Good day. And thank you for standing by. Welcome to the Quarter Three 2023 Tile Shop Holdings, Inc. Earnings Conference Call. At this time, all participants are in a listen-only mode. After the speakers’ presentation, there will be a question-and-answer session. […] |
Tile Shop Holdings Inc (TTSH) Reports 5.2% Decrease in Net Sales for Q3 2023Company's Net Income Stands at $1.8 Million with Adjusted EBITDA of $8.3 Million |
The Tile Shop Reports Third Quarter 2023 ResultsMINNEAPOLIS, Nov. 02, 2023 (GLOBE NEWSWIRE) -- Tile Shop Holdings, Inc. (Nasdaq: TTSH) (the “Company”), a specialty retailer of natural stone, man-made and luxury vinyl tiles, today announced results for its third quarter ended September 30, 2023. Third Quarter Summary Net Sales Decreased 5.2%Comparable Store Sales Decreased 4.9% Gross Margin of 64.7%Net Income of $1.8 Million and Adjusted EBITDA of $8.3 MillionDiluted Earnings per Share of $0.04Reduced Long-Term Debt by $10.0 Million in the Thi |
The Tile Shop to Host Third Quarter 2023 Earnings Conference CallMINNEAPOLIS, Oct. 26, 2023 (GLOBE NEWSWIRE) -- Tile Shop Holdings, Inc. (Nasdaq: TTSH) (the “Company”), a specialty retailer of natural stone, man-made and luxury vinyl tiles, setting and maintenance materials and related accessories, today announced that the Company will release financial results for the third quarter ended September 30, 2023 at 7:00 a.m. Eastern Time on Thursday, November 2, 2023. The Company will host a conference call via webcast for investors and other interested parties be |
TTSH Price Returns
1-mo | 28.25% |
3-mo | 28.25% |
6-mo | 23.15% |
1-year | 65.29% |
3-year | 58.37% |
5-year | 24.84% |
YTD | 55.48% |
2022 | -38.57% |
2021 | 65.81% |
2020 | 154.44% |
2019 | -68.00% |
2018 | -41.13% |
Loading social stream, please wait...