Tupperware Brands Corporation (TUP): Price and Financial Metrics
GET POWR RATINGS... FREE!
TUP POWR Grades
- Quality is the dimension where TUP ranks best; there it ranks ahead of 99.4% of US stocks.
- The strongest trend for TUP is in Momentum, which has been heading up over the past 179 days.
- TUP ranks lowest in Growth; there it ranks in the 6th percentile.
TUP Stock Summary
- Tupperware Brands Corp's capital turnover -- a measure of revenue relative to shareholder's equity -- is better than merely 1.84% of US listed stocks.
- Of note is the ratio of Tupperware Brands Corp's sales and general administrative expense to its total operating expenses; 96.86% of US stocks have a lower such ratio.
- Equity multiplier, or assets relative to shareholders' equity, comes in at -7.01 for Tupperware Brands Corp; that's greater than it is for only 2.27% of US stocks.
- If you're looking for stocks that are quantitatively similar to Tupperware Brands Corp, a group of peers worth examining would be JILL, GBLI, NVFY, UFCS, and SCHL.
- Visit TUP's SEC page to see the company's official filings. To visit the company's web site, go to www.tupperwarebrands.com.
TUP Valuation Summary
- TUP's price/sales ratio is 0.6; this is 80.65% lower than that of the median Consumer Cyclical stock.
- Over the past 243 months, TUP's price/sales ratio has gone down 0.7.
Below are key valuation metrics over time for TUP.
Stock | Date | P/S | P/B | P/E | EV/EBIT |
---|---|---|---|---|---|
TUP | 2021-08-27 | 0.6 | -10.5 | 8.6 | 5.9 |
TUP | 2021-08-26 | 0.6 | -10.3 | 8.5 | 5.8 |
TUP | 2021-08-25 | 0.6 | -10.9 | 9.0 | 6.1 |
TUP | 2021-08-24 | 0.6 | -10.7 | 8.8 | 6.0 |
TUP | 2021-08-23 | 0.6 | -10.3 | 8.5 | 5.8 |
TUP | 2021-08-20 | 0.6 | -9.9 | 8.1 | 5.7 |
TUP Growth Metrics
- The 5 year net income to common stockholders growth rate now stands at -116.17%.
- Its 4 year net income to common stockholders growth rate is now at -116.17%.
- Its 4 year cash and equivalents growth rate is now at 76.98%.

The table below shows TUP's growth in key financial areas (numbers in millions of US dollars).
Date | Revenue | Operating Cash Flow | Net Income to Common Stock |
---|---|---|---|
2021-12-31 | 1,602.3 | 111.4 | 18.6 |
2021-09-30 | 1,791.5 | 57.9 | 16.6 |
2021-06-30 | 1,891.8 | 122.2 | 137.1 |
2021-03-31 | 1,824.5 | 199.5 | 165.3 |
2020-12-31 | 1,740.1 | 166.1 | 112.2 |
2020-09-30 | 1,667.7 | 179.7 | 18.7 |
TUP's Quality Factors
The “Quality” component of the POWR Ratings focuses on 31 different factors of a companies fundamentals and operational strength. Here are some key insights as we drill into the specifics of these quality attributes.- TUP has a Quality Grade of A, ranking ahead of 98.88% of graded US stocks.
- TUP's asset turnover comes in at 1.566 -- ranking 2nd of 22 Rubber and Plastic Products stocks.
- WST, MYE, and ENTG are the stocks whose asset turnover ratios are most correlated with TUP.
The table below shows TUP's key quality metrics over time.
Period | Asset Turnover | Gross Margin | ROIC |
---|---|---|---|
2021-06-26 | 1.566 | 0.686 | 0.394 |
2021-03-27 | 1.510 | 0.683 | 0.458 |
2020-12-26 | 1.420 | 0.672 | 0.306 |
2020-09-26 | 1.349 | 0.659 | 0.159 |
2020-06-27 | 1.265 | 0.653 | 0.094 |
2020-03-28 | 1.268 | 0.657 | 0.064 |
TUP Price Target
For more insight on analysts targets of TUP, see our TUP price target page. And for a list of of all stocks sorted by upside potential based on analyst target price, see our Top Price Target page.
Average Price Target | $38.75 | Average Broker Recommendation | 1.4 (Strong Buy) |
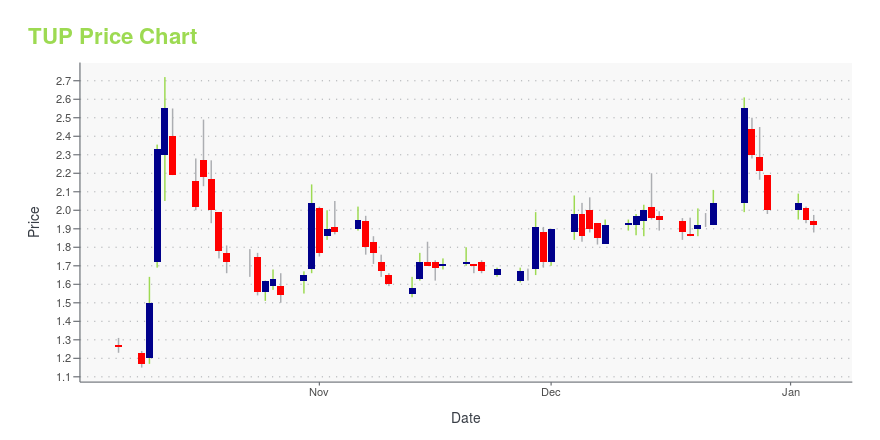
TUP Stock Price Chart Interactive Chart >
TUP Price/Volume Stats
Current price | $6.62 | 52-week high | $25.44 |
Prev. close | $7.16 | 52-week low | $5.54 |
Day low | $6.59 | Volume | 945,300 |
Day high | $7.35 | Avg. volume | 1,117,010 |
50-day MA | $9.67 | Dividend yield | N/A |
200-day MA | $16.17 | Market Cap | 303.49M |
Tupperware Brands Corporation (TUP) Company Bio
Tupperware Brands operates as a direct-to-consumer marketer of various products across a range of brands and categories worldwide. The company engages in the manufacture and sale of design-centric preparation, storage, and serving solutions for the kitchen and home, as well as a line of cookware, knives, microwave products, microfiber textiles, and water related items under the Tupperware brand name. The company was founded in 1996 and is based in Orlando, Florida.
Latest TUP News From Around the Web
Below are the latest news stories about Tupperware Brands Corp that investors may wish to consider to help them evaluate TUP as an investment opportunity.
Tupperware Non-GAAP EPS of $0.38 misses by $0.16, revenue of $394.9M beats by $9.93MTupperware press release (NYSE:TUP): Q4 Non-GAAP EPS of $0.38 misses by $0.16. Revenue of $394.9M (-11.9% Y/Y) beats by $9.93M. For FY2022, the company expects diluted adjusted earnings per share to be between $2.60 to $3.20 vs. consensus of $3.18, and operating cash flow net of investing cash flow to... |
Tupperware Brands Corp (TUP) CEO Miguel Fernandez on Q4 2021 Results - Earnings Call TranscriptTupperware Brands Corp (TUP) Q4 2021 Earnings Conference Call February 23, 2022, 08:30 ET Company Participants Alexis Callahan - VP, IR Miguel Fernandez - President, CEO & Director Cassandra Harris - CFO & COO Conference Call Participants Anthony Lebiedzinski - Sidoti & Company Douglas Lane - Lane Research Linda Bolton-Weiser... |
Tupperware Brands (TUP) Q4 2021 Earnings Call TranscriptJoining me today are Miguel Fernandez, president and CEO; and Sandra Harris, CFO and COO. Earlier this morning, we issued a press release announcing our financial results for the fourth quarter of 2021, which is available on our Investor Relations website. In addition to today's press release, we have also published supplemental materials to accompany our prepared remarks, and both items can be found on our Investor Relations website. |
Tupperware Stock Is Falling. Earnings Missed.Tupperware's fourth-quarter report disappointed, and the midpoint of 2022 earnings-per-share guidance fell short of the consensus estimate. |
Tupperware Brands Registers 12% Sales Decline In Q4View more earnings on TUPSee more from BenzingaMolson Coors Beverage Clocks 14% Sales Growth In Q4, Tops Consensus; Boosts Dividend By 12%LL Flooring Clocks 6% Sales Decline In Q4, Expects Challenging 1H'22© 2022 Benzinga.com. Benzinga does not provide investment advice. All rights reserved. |
TUP Price Returns
1-mo | N/A |
3-mo | -65.96% |
6-mo | -56.70% |
1-year | -71.89% |
3-year | -64.62% |
5-year | -89.23% |
YTD | -56.70% |
2021 | -52.79% |
2020 | 277.51% |
2019 | -71.70% |
2018 | -45.99% |
2017 | 24.38% |
Continue Researching TUP
Want to do more research on Tupperware Brands Corp's stock and its price? Try the links below:Tupperware Brands Corp (TUP) Stock Price | Nasdaq
Tupperware Brands Corp (TUP) Stock Quote, History and News - Yahoo Finance
Tupperware Brands Corp (TUP) Stock Price and Basic Information | MarketWatch
Loading social stream, please wait...