
Tuya Inc. ADR (TUYA): Price and Financial Metrics
TUYA Price/Volume Stats
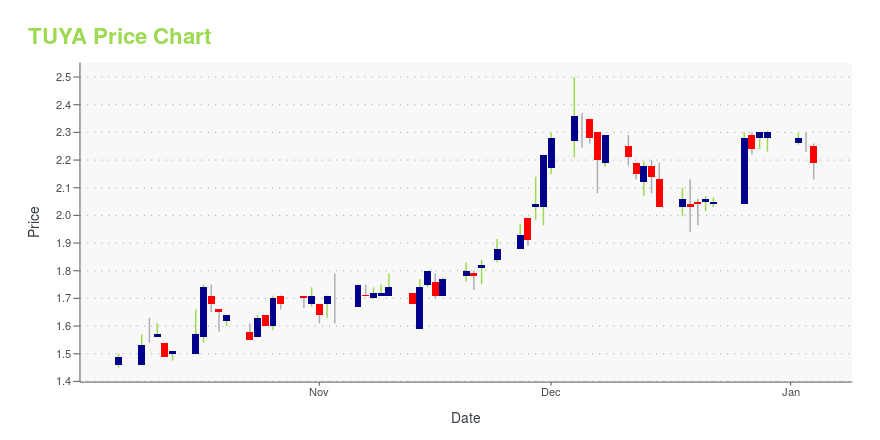
| Current price | $1.56 | 52-week high | $2.50 |
| Prev. close | $1.55 | 52-week low | $1.40 |
| Day low | $1.56 | Volume | 122,953 |
| Day high | $1.59 | Avg. volume | 272,110 |
| 50-day MA | $1.78 | Dividend yield | N/A |
| 200-day MA | $1.84 | Market Cap | 786.84M |
TUYA Stock Price Chart Interactive Chart >
Tuya Inc. ADR (TUYA) Company Bio
Tuya Inc. (Chinese: 涂鸦智能; lit. 'Graffiti Intelligence'; dba Tuya Smart) is a Chinese artificial intelligence and Internet of things (IoT) platform as a service provider founded in 2014. The company provides a cloud development and management platform to developers, brands, and OEMs to program, manage, and monetize smart home and IoT devices. (Source:Wikipedia)
Latest TUYA News From Around the Web
Below are the latest news stories about TUYA INC that investors may wish to consider to help them evaluate TUYA as an investment opportunity.
Tuya Inc. Sponsored ADR (TUYA) Is Up 0.99% in One Week: What You Should KnowDoes Tuya Inc. Sponsored ADR (TUYA) have what it takes to be a top stock pick for momentum investors? Let's find out. |
Tuya Smart to Showcase Its Cutting-edge Technologies and Innovative Solutions at CES 2024Tuya Smart (NYSE: TUYA, HKEX:2391), a global IoT developer service provider, announced that it would bring an extensive range of cutting-edge solutions to CES 2024 to present its green and low-carbon development philosophy to developers worldwide. In line with the theme of CES 2024, "ALL TOGETHER, ALL ON", global businesses are seeking to enhance the level of inclusivity and engagement for consumer electronics products. Tuya followed the main theme and established its exhibition hall under the t |
Are You Looking for a Top Momentum Pick? Why Tuya Inc. Sponsored ADR (TUYA) is a Great ChoiceDoes Tuya Inc. Sponsored ADR (TUYA) have what it takes to be a top stock pick for momentum investors? Let's find out. |
Tuya Reports Third Quarter 2023 Unaudited Financial ResultsTuya Inc. ("Tuya" or the "Company") (NYSE: TUYA; HKEX: 2391), a global leading IoT cloud development platform, today announced its unaudited financial results for the third quarter ended September 30, 2023. |
Tuya to Report Third Quarter 2023 Financial Results on November 28, 2023 Eastern TimeTuya Inc. ("Tuya" or the "Company") (NYSE: TUYA; HKEX: 2391), a global leading IoT cloud development platform, today announced that it will report its third quarter 2023 unaudited financial results after the market closes on Tuesday, November 28, 2023. |
TUYA Price Returns
| 1-mo | -11.36% |
| 3-mo | -10.34% |
| 6-mo | -17.46% |
| 1-year | 4.70% |
| 3-year | -91.93% |
| 5-year | N/A |
| YTD | -32.17% |
| 2023 | 20.42% |
| 2022 | -69.44% |
| 2021 | N/A |
| 2020 | N/A |
| 2019 | N/A |
Loading social stream, please wait...