Titan International, Inc. (DE) (TWI): Price and Financial Metrics
TWI Price/Volume Stats
Current price | $13.49 | 52-week high | $17.29 |
Prev. close | $13.07 | 52-week low | $9.23 |
Day low | $13.05 | Volume | 404,200 |
Day high | $13.54 | Avg. volume | 418,322 |
50-day MA | $12.72 | Dividend yield | N/A |
200-day MA | $11.81 | Market Cap | 834.90M |
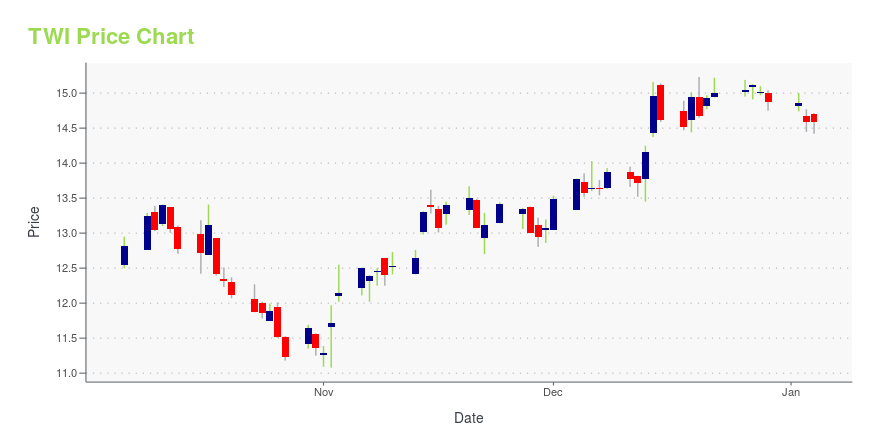
TWI Stock Price Chart Interactive Chart >
TWI POWR Grades
- TWI scores best on the Value dimension, with a Value rank ahead of 99.55% of US stocks.
- TWI's strongest trending metric is Growth; it's been moving down over the last 177 days.
- TWI ranks lowest in Growth; there it ranks in the 5th percentile.
TWI Stock Summary
- TITAN INTERNATIONAL INC's capital turnover -- a measure of revenue relative to shareholder's equity -- is better than 89.43% of US listed stocks.
- TWI's current price/earnings ratio is 6.29, which is higher than merely 10.81% of US stocks with positive earnings.
- With a price/sales ratio of 0.4, TITAN INTERNATIONAL INC has a higher such ratio than just 15.63% of stocks in our set.
- Stocks with similar financial metrics, market capitalization, and price volatility to TITAN INTERNATIONAL INC are EPC, LXFR, OEC, ANGI, and CMCO.
- Visit TWI's SEC page to see the company's official filings. To visit the company's web site, go to www.titan-intl.com.
TWI Valuation Summary
- TWI's EV/EBIT ratio is 6.2; this is 60% lower than that of the median Industrials stock.
- TWI's price/earnings ratio has moved up 7.1 over the prior 243 months.
Below are key valuation metrics over time for TWI.
Stock | Date | P/S | P/B | P/E | EV/EBIT |
---|---|---|---|---|---|
TWI | 2023-11-09 | 0.4 | 1.8 | 6.2 | 6.2 |
TWI | 2023-11-08 | 0.4 | 1.8 | 6.3 | 6.2 |
TWI | 2023-11-07 | 0.4 | 1.8 | 6.2 | 6.2 |
TWI | 2023-11-06 | 0.4 | 1.8 | 6.3 | 6.2 |
TWI | 2023-11-03 | 0.4 | 1.7 | 6.1 | 6.1 |
TWI | 2023-11-02 | 0.4 | 1.7 | 5.9 | 5.9 |
TWI Growth Metrics
- Its 2 year revenue growth rate is now at 40.07%.
- Its 4 year net income to common stockholders growth rate is now at -94.08%.
- Its 5 year revenue growth rate is now at 6.04%.

The table below shows TWI's growth in key financial areas (numbers in millions of US dollars).
Date | Revenue | Operating Cash Flow | Net Income to Common Stock |
---|---|---|---|
2022-09-30 | 2,147.29 | 115.256 | 161.86 |
2022-06-30 | 2,066.95 | 77.131 | 129.878 |
2022-03-31 | 1,932.694 | 8.171 | 59.934 |
2021-12-31 | 1,780.215 | 10.726 | 49.586 |
2021-09-30 | 1,619.447 | 7.508 | 4.774 |
2021-06-30 | 1,473.837 | 34.241 | -19.056 |
TWI's Quality Factors
The “Quality” component of the POWR Ratings focuses on 31 different factors of a companies fundamentals and operational strength. Here are some key insights as we drill into the specifics of these quality attributes.- TWI has a Quality Grade of C, ranking ahead of 27.59% of graded US stocks.
- TWI's asset turnover comes in at 1.388 -- ranking 10th of 40 Steel Works Etc stocks.
- GLW, CENX, and UAMY are the stocks whose asset turnover ratios are most correlated with TWI.
The table below shows TWI's key quality metrics over time.
Period | Asset Turnover | Gross Margin | ROIC |
---|---|---|---|
2021-06-30 | 1.388 | 0.117 | 0.020 |
2021-03-31 | 1.273 | 0.106 | 0.017 |
2020-12-31 | 1.217 | 0.091 | -0.021 |
2020-09-30 | 1.169 | 0.087 | -0.027 |
2020-06-30 | 1.161 | 0.080 | -0.029 |
2020-03-31 | 1.191 | 0.080 | -0.033 |
TWI Price Target
For more insight on analysts targets of TWI, see our TWI price target page. And for a list of of all stocks sorted by upside potential based on analyst target price, see our Top Price Target page.
Average Price Target | $13.00 | Average Broker Recommendation | 2 (Hold) |
Titan International, Inc. (DE) (TWI) Company Bio
Titan International supplies wheels, tires, assemblies and undercarriage product for off-highway equipment used in agricultural, earthmoving/construction and consumer applications. The company was founded in 1890 and is based in Quincy, Illinois.
Latest TWI News From Around the Web
Below are the latest news stories about TITAN INTERNATIONAL INC that investors may wish to consider to help them evaluate TWI as an investment opportunity.
Zacks Industry Outlook Highlights Deere & Co, AGCO Alamo Group, Titan International and CNH IndustrialDeere & Co, AGCO, Alamo Group, Titan International and CNH Industrial are part of Zacks Industry Outlook article. |
4 Farm Equipment Stocks in Focus on Strong Industry TrendsThe Manufacturing - Farm Equipment industry stocks Deere (DE), AGCO Corp (AGCO) Alamo Group (ALG) and Titan International (TWI) are set to gain from improving farm income, commodity prices and investment in technology. |
Should Value Investors Buy Titan International (TWI) Stock?Here at Zacks, our focus is on the proven Zacks Rank system, which emphasizes earnings estimates and estimate revisions to find great stocks. Nevertheless, we are always paying attention to the latest value, growth, and momentum trends to underscore strong picks. |
TITAN INTERNATIONAL, INC. TO PARTICIPATE IN NOVEMBER INVESTOR CONFERENCESTitan International, Inc. (NYSE: TWI) ("Titan" or the "Company"), a leading global manufacturer of off-highway wheels, tires, assemblies, and undercarriage products, today announced that management will participate in the following investor conferences in the month of November: |
Those who invested in Titan International (NYSE:TWI) three years ago are up 156%The most you can lose on any stock (assuming you don't use leverage) is 100% of your money. But if you buy shares in a... |
TWI Price Returns
1-mo | 11.03% |
3-mo | 10.57% |
6-mo | 19.06% |
1-year | -6.19% |
3-year | 127.87% |
5-year | N/A |
YTD | -11.95% |
2022 | 39.78% |
2021 | 125.51% |
2020 | 34.64% |
2019 | -21.92% |
2018 | -63.73% |
Continue Researching TWI
Want to see what other sources are saying about Titan International Inc's financials and stock price? Try the links below:Titan International Inc (TWI) Stock Price | Nasdaq
Titan International Inc (TWI) Stock Quote, History and News - Yahoo Finance
Titan International Inc (TWI) Stock Price and Basic Information | MarketWatch
Loading social stream, please wait...