
Twin Disc, Incorporated (TWIN): Price and Financial Metrics
TWIN Price/Volume Stats
| Current price | $14.94 | 52-week high | $18.00 |
| Prev. close | $14.55 | 52-week low | $10.90 |
| Day low | $14.68 | Volume | 33,900 |
| Day high | $14.98 | Avg. volume | 47,145 |
| 50-day MA | $13.23 | Dividend yield | 1.14% |
| 200-day MA | $14.75 | Market Cap | 209.12M |
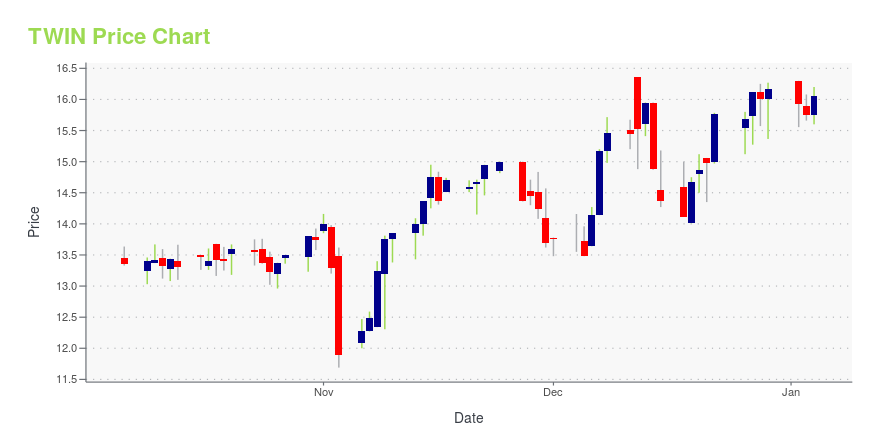
TWIN Stock Price Chart Interactive Chart >
Twin Disc, Incorporated (TWIN) Company Bio
Twin Disc, Incorporated designs, manufactures, and sells marine and heavy duty off-highway power transmission equipment worldwide. The company was founded in 1918 and is based in Racine, Wisconsin.
Latest TWIN News From Around the Web
Below are the latest news stories about TWIN DISC INC that investors may wish to consider to help them evaluate TWIN as an investment opportunity.
Should Income Investors Look At Twin Disc, Incorporated (NASDAQ:TWIN) Before Its Ex-Dividend?Some investors rely on dividends for growing their wealth, and if you're one of those dividend sleuths, you might be... |
Twin Disc, Incorporated (NASDAQ:TWIN) Q1 2024 Earnings Call TranscriptTwin Disc, Incorporated (NASDAQ:TWIN) Q1 2024 Earnings Call Transcript November 4, 2023 Operator: Ladies and gentlemen, thank you for standing by, and welcome to the Twin Disc, Inc. Fiscal First Quarter 2024 Conference Call. [Operator Instructions] Thank you. Jeff Knutson, you may begin your conference. Jeff Knutson: Good morning, and thank you for joining us […] |
Q1 2024 Twin Disc Inc Earnings CallQ1 2024 Twin Disc Inc Earnings Call |
Twin Disc Inc (TWIN) Reports 13.7% Increase in Q1 FY24 SalesCompany reinstates quarterly dividend following robust margin expansion and solid cash generation |
Twin Disc Reinstates Quarterly Cash DividendMILWAUKEE, Nov. 02, 2023 (GLOBE NEWSWIRE) -- Twin Disc, Inc. (NASDAQ: TWIN), today announced that the Board of Directors (the "Board") reinstated a regular quarterly cash dividend of $0.04 per share payable on December 1, 2023, to shareholders of record at the close of business on November 17, 2023. This resumption of Twin Disc’s quarterly dividend following the suspension of the program in February 2016 reflects the Company’s ongoing progress towards achieving its medium-term financial targets. |
TWIN Price Returns
| 1-mo | 30.14% |
| 3-mo | -9.53% |
| 6-mo | -6.35% |
| 1-year | 25.52% |
| 3-year | 4.24% |
| 5-year | 16.94% |
| YTD | -7.05% |
| 2023 | 66.71% |
| 2022 | -11.31% |
| 2021 | 39.62% |
| 2020 | -28.77% |
| 2019 | -25.29% |
TWIN Dividends
| Ex-Dividend Date | Type | Payout Amount | Change | ||||||
|---|---|---|---|---|---|---|---|---|---|
| Loading, please wait... | |||||||||
Continue Researching TWIN
Here are a few links from around the web to help you further your research on Twin Disc Inc's stock as an investment opportunity:Twin Disc Inc (TWIN) Stock Price | Nasdaq
Twin Disc Inc (TWIN) Stock Quote, History and News - Yahoo Finance
Twin Disc Inc (TWIN) Stock Price and Basic Information | MarketWatch
Loading social stream, please wait...