
10x Genomics Inc. (TXG): Price and Financial Metrics
TXG Price/Volume Stats
| Current price | $20.22 | 52-week high | $63.57 |
| Prev. close | $19.92 | 52-week low | $15.28 |
| Day low | $19.71 | Volume | 1,648,307 |
| Day high | $20.80 | Avg. volume | 1,662,310 |
| 50-day MA | $20.53 | Dividend yield | N/A |
| 200-day MA | $35.92 | Market Cap | 2.41B |
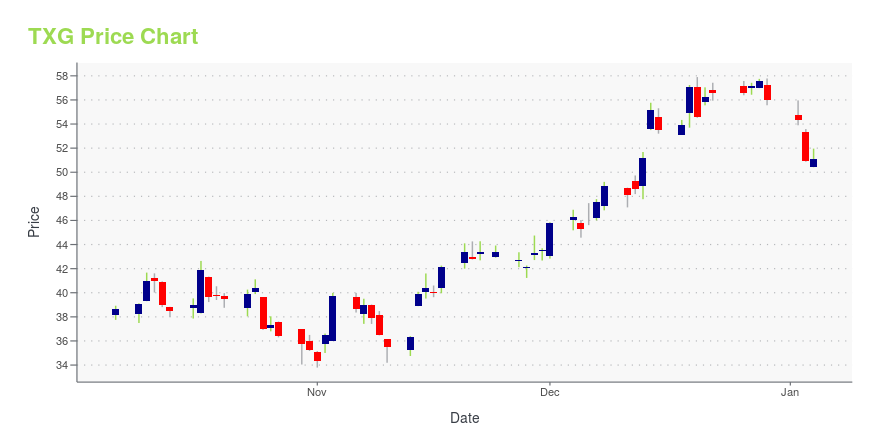
TXG Stock Price Chart Interactive Chart >
10x Genomics Inc. (TXG) Company Bio
10x Genomics, Inc. is an American biotechnology company that designs and manufactures gene sequencing technology used in scientific research. It was founded in 2012 by Serge Saxonov, Ben Hindson, and Kevin Ness. (Source:Wikipedia)
Latest TXG News From Around the Web
Below are the latest news stories about 10X GENOMICS INC that investors may wish to consider to help them evaluate TXG as an investment opportunity.
10x Genomics to Present at the 42nd Annual J.P. Morgan Healthcare Conference10x Genomics, Inc. (Nasdaq: TXG), a leader in single cell and spatial biology, today announced that members of its management team will present at the 42nd Annual J.P. Morgan Healthcare Conference on Monday, January 8, at 9:00 a.m. Pacific Time. |
10x Genomics Launches Xenium Catalyst Network10x Genomics, Inc., (Nasdaq: TXG), a leader in single cell and spatial biology, today announced the launch of its Xenium Catalyst Network, a global group of technically qualified research institutions that will accelerate access to Xenium proof-of-concept data for researchers worldwide. The four founding members of the Xenium Catalyst Network will add significant capacity for the company's Xenium Catalyst Program, a technical access service launched earlier this year for prospective customers. |
Integrative Study Conducted by 10x Genomics Combines Single Cell, Spatial and In Situ Analyses to Investigate Tumor Invasiveness10x Genomics, Inc. (Nasdaq: TXG), a leader in single cell and spatial biology, announced today that Nature Communications has published a 10x-conducted study using the Chromium Single Cell, Visium Spatial and Xenium In Situ platforms as part of an integrative approach to understand how tumor microenvironment differences influence invasiveness. |
Cathie Wood Just Dumped $40 Million of Coinbase Global (COIN) StockWood is moving away from fintech and Internet names like COIN stock. |
High Sensitivity and Specificity of the Xenium Platform from 10x Genomics Outperforms NanoString's CosMx and Vizgen's Merscope in Benchmarking Preprint10x Genomics, Inc. (Nasdaq: TXG), a leader in single cell and spatial biology, announced today that a new non-peer-reviewed study has independently evaluated the technical performance of three spatial imaging platforms and found the Xenium In Situ platform demonstrated higher quality transcript counts per gene at higher specificity for 22 formalin-fixed paraffin-embedded (FFPE) tissues compared to NanoString's CosMx and Vizgen's MERSCOPE. This comparison, presented in a preprint posted to bioRxi |
TXG Price Returns
| 1-mo | 3.69% |
| 3-mo | -26.71% |
| 6-mo | -53.22% |
| 1-year | -66.69% |
| 3-year | -88.75% |
| 5-year | N/A |
| YTD | -63.87% |
| 2023 | 53.57% |
| 2022 | -75.54% |
| 2021 | 5.20% |
| 2020 | 85.70% |
| 2019 | N/A |
Loading social stream, please wait...