TherapeuticsMD, Inc. (TXMD): Price and Financial Metrics

TherapeuticsMD, Inc. (TXMD): $2.29

0.04 (+1.78%)

POWR Rating

Component Grades

Momentum

D

Stability

C

Sentiment

Quality

C

Add TXMD to Watchlist
Sign Up

TXMD Price/Volume Stats

Current price $2.29 52-week high $4.72
Prev. close $2.25 52-week low $1.95
Day low $2.25 Volume 12,300
Day high $2.31 Avg. volume 18,652
50-day MA $2.32 Dividend yield N/A
200-day MA $2.91 Market Cap 24.23M

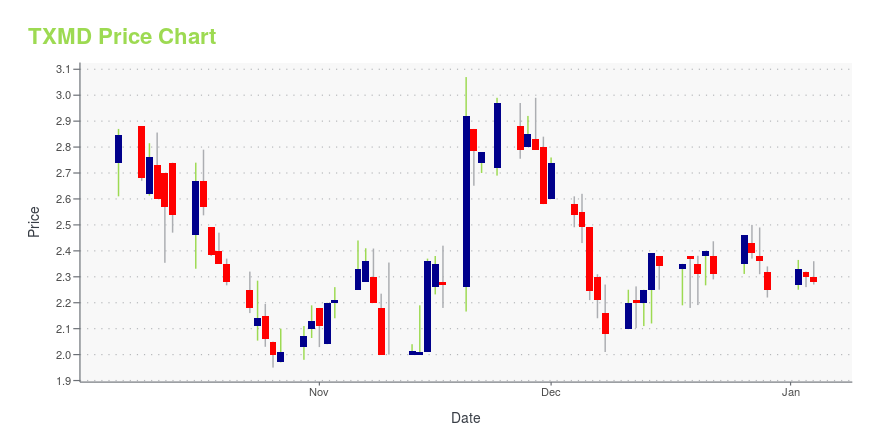
TXMD Stock Price Chart Interactive Chart >

TXMD POWR Grades

  • Value is the dimension where TXMD ranks best; there it ranks ahead of 62.36% of US stocks.
  • The strongest trend for TXMD is in Sentiment, which has been heading down over the past 32 days.
  • TXMD's current lowest rank is in the Momentum metric (where it is better than 20.86% of US stocks).

TXMD Stock Summary

  • TXMD's current price/earnings ratio is 0.36, which is higher than only 0.17% of US stocks with positive earnings.
  • Of note is the ratio of THERAPEUTICSMD INC's sales and general administrative expense to its total operating expenses; 99.18% of US stocks have a lower such ratio.
  • For TXMD, its debt to operating expenses ratio is greater than that reported by just 0.2% of US equities we're observing.
  • If you're looking for stocks that are quantitatively similar to THERAPEUTICSMD INC, a group of peers worth examining would be AGE, GGB, FTFT, AMCR, and CPHI.
  • Visit TXMD's SEC page to see the company's official filings. To visit the company's web site, go to www.therapeuticsmd.com.

TXMD Valuation Summary

  • TXMD's price/sales ratio is 12.2; this is 454.55% higher than that of the median Healthcare stock.
  • Over the past 143 months, TXMD's EV/EBIT ratio has gone up 17.1.

Below are key valuation metrics over time for TXMD.

Stock Date P/S P/B P/E EV/EBIT
TXMD 2023-12-29 12.2 0.8 0.3 0.5
TXMD 2023-12-28 12.8 0.9 0.4 0.6
TXMD 2023-12-27 13.0 0.9 0.4 0.6
TXMD 2023-12-26 13.3 0.9 0.4 0.6
TXMD 2023-12-22 12.5 0.9 0.4 0.6
TXMD 2023-12-21 13.0 0.9 0.4 0.6

TXMD Growth Metrics

    The 4 year net cashflow from operations growth rate now stands at -137.17%.
  • Its 2 year price growth rate is now at -95.09%.
  • Its 3 year price growth rate is now at -98.3%.
Over the past 15 months, TXMD's revenue has gone up $2,701,410.

The table below shows TXMD's growth in key financial areas (numbers in millions of US dollars).

Date Revenue Operating Cash Flow Net Income to Common Stock
2022-09-30 87.489 -103.408 -8.665
2022-06-30 91.978 -122.711 -27.12
2022-03-31 86.418 -133.839 -182.053
2021-12-31 86.951 -142.693 -172.415
2021-09-30 90.85079 -133.4563 -171.5426
2021-06-30 84.78759 -129.282 -156.7337

TXMD's Quality Factors

The “Quality” component of the POWR Ratings focuses on 31 different factors of a companies fundamentals and operational strength. Here are some key insights as we drill into the specifics of these quality attributes.
  • TXMD has a Quality Grade of D, ranking ahead of 19.35% of graded US stocks.
  • TXMD's asset turnover comes in at 0.419 -- ranking 109th of 682 Pharmaceutical Products stocks.
  • ALNY, QGEN, and CASI are the stocks whose asset turnover ratios are most correlated with TXMD.

The table below shows TXMD's key quality metrics over time.

Period Asset Turnover Gross Margin ROIC
2021-06-30 0.419 0.791 -0.569
2021-03-31 0.361 0.752 -0.564
2020-12-31 0.311 0.754 -0.620
2020-09-30 0.254 0.772 -0.681
2020-06-30 0.253 0.817 -0.738
2020-03-31 0.225 0.857 -0.822

TXMD Price Target

For more insight on analysts targets of TXMD, see our TXMD price target page. And for a list of of all stocks sorted by upside potential based on analyst target price, see our Top Price Target page.

Average Price Target $5.80 Average Broker Recommendation 1.38 (Strong Buy)

TherapeuticsMD, Inc. (TXMD) Company Bio


TherapeuticsMD, Inc. operates as a women’s health care product company. The company manufactures and distributes prescription and over-the-counter product lines, including prenatal vitamins, iron supplements, vitamin D supplements, and natural menopause relief products under the vitaMedMD brand, as well as duplicate formulations of its prescription prenatal vitamins products under the BocaGreenMD Prena1 name. The company was founded in 2008 and is based in Boca Raton, Florida.


TXMD Latest News Stream


Event/Time News Detail
Loading, please wait...

TXMD Latest Social Stream


Loading social stream, please wait...

View Full TXMD Social Stream

Latest TXMD News From Around the Web

Below are the latest news stories about THERAPEUTICSMD INC that investors may wish to consider to help them evaluate TXMD as an investment opportunity.

TherapeuticsMD Announces Third Quarter 2023 Financial Results

BOCA RATON, Fla., November 14, 2023--TherapeuticsMD, Inc. ("TherapeuticsMD" or the "Company") (NASDAQ: TXMD), a company that owns rights to pharmaceutical royalties, today reported financial results for the third quarter ended September 30, 2023.

Yahoo | November 14, 2023

TherapeuticsMD Announces Second Quarter 2023 Financial Results

BOCA RATON, Fla., August 14, 2023--TherapeuticsMD, Inc. ("TherapeuticsMD" or the "Company") (NASDAQ: TXMD), a company that owns rights to pharmaceutical royalties, today reported financial results for the second quarter ended June 30, 2023.

Yahoo | August 14, 2023

TherapeuticsMD Announces First Quarter 2023 Financial Results

BOCA RATON, Fla., May 15, 2023--TherapeuticsMD, Inc. ("TherapeuticsMD" or the "Company") (NASDAQ: TXMD), a company that owns rights to pharmaceutical royalties, today reported financial results for the first quarter ended March 31, 2023.

Yahoo | May 15, 2023

All You Need to Know About TherapeuticsMD (TXMD) Rating Upgrade to Buy

TherapeuticsMD (TXMD) has been upgraded to a Zacks Rank #2 (Buy), reflecting growing optimism about the company's earnings prospects. This might drive the stock higher in the near term.

Yahoo | April 14, 2023

TherapeuticsMD Announces Full Year 2022 Financial Results and Provides Update on Business Model Transition

BOCA RATON, Fla., April 07, 2023--TherapeuticsMD, Inc. ("TherapeuticsMD" or the "Company") (NASDAQ: TXMD), a company that owns rights to pharmaceutical royalties, today reported financial results for the full year ended December 31, 2022.

Yahoo | April 7, 2023

Read More 'TXMD' Stories Here

TXMD Price Returns

1-mo -3.38%
3-mo 1.78%
6-mo -24.17%
1-year -38.11%
3-year -96.58%
5-year -99.06%
YTD 1.78%
2023 -59.75%
2022 -68.55%
2021 -70.62%
2020 -50.00%
2019 -36.48%

Continue Researching TXMD

Here are a few links from around the web to help you further your research on TherapeuticsMD Inc's stock as an investment opportunity:

TherapeuticsMD Inc (TXMD) Stock Price | Nasdaq
TherapeuticsMD Inc (TXMD) Stock Quote, History and News - Yahoo Finance
TherapeuticsMD Inc (TXMD) Stock Price and Basic Information | MarketWatch

Get Free Updates

Join thousands of investors who get the latest news, insights and top rated picks from StockNews.com!