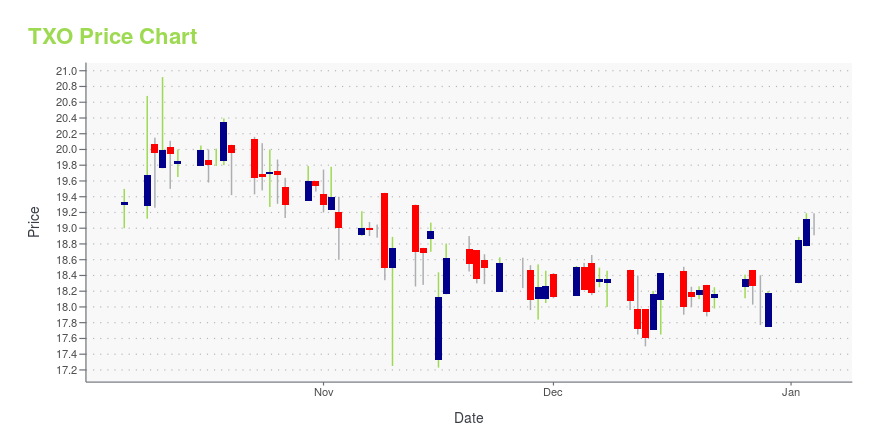
TXO Energy Partners L.P. (TXO): Price and Financial Metrics
TXO Price/Volume Stats
| Current price | $20.23 | 52-week high | $23.56 |
| Prev. close | $20.10 | 52-week low | $17.20 |
| Day low | $20.01 | Volume | 56,176 |
| Day high | $20.36 | Avg. volume | 65,193 |
| 50-day MA | $21.08 | Dividend yield | 12.64% |
| 200-day MA | $19.19 | Market Cap | 625.88M |
TXO Stock Price Chart Interactive Chart >
Latest TXO News From Around the Web
Below are the latest news stories about TXO PARTNERS LP that investors may wish to consider to help them evaluate TXO as an investment opportunity.
Insider Stock Buying Reaches US$8.35m On TXO PartnersQuite a few insiders have dramatically grown their holdings in TXO Partners L.P. ( NYSE:TXO ) over the past 12 months... |
CEO & Chairman of the Board of TXO Energy GP of TXO Partners Picks Up 6.7% More StockTXO Partners L.P. ( NYSE:TXO ) shareholders (or potential shareholders) will be happy to see that the CEO & Chairman of... |
TXO Partners LP (TXO) Loses -7.22% in 4 Weeks, Here's Why a Trend Reversal May be Around the CornerThe heavy selling pressure might have exhausted for TXO Partners LP (TXO) as it is technically in oversold territory now. In addition to this technical measure, strong agreement among Wall Street analysts in revising earnings estimates higher indicates that the stock is ripe for a trend reversal. |
TXO Partners Declares a Third Quarter 2023 Distribution of $0.52 on Common Units; Files Quarterly Report on Form 10-QFORT WORTH, Texas, November 07, 2023--TXO Partners, L.P. (NYSE: TXO) announced today that the Board of Directors of its general partner declared a distribution of $0.52 per common unit for the quarter ended September 30, 2023. The quarterly distribution will be paid on November 27, 2023, to eligible unitholders of record as of the close of trading on November 17, 2023. |
How Much Upside is Left in TXO Partners LP (TXO)? Wall Street Analysts Think 58.91%The mean of analysts' price targets for TXO Partners LP (TXO) points to a 58.9% upside in the stock. While this highly sought-after metric has not proven reasonably effective, strong agreement among analysts in raising earnings estimates does indicate an upside in the stock. |
TXO Price Returns
| 1-mo | -1.80% |
| 3-mo | 11.05% |
| 6-mo | 13.86% |
| 1-year | 6.36% |
| 3-year | N/A |
| 5-year | N/A |
| YTD | 18.37% |
| 2023 | N/A |
| 2022 | N/A |
| 2021 | N/A |
| 2020 | N/A |
| 2019 | N/A |
TXO Dividends
| Ex-Dividend Date | Type | Payout Amount | Change | ||||||
|---|---|---|---|---|---|---|---|---|---|
| Loading, please wait... | |||||||||


Loading social stream, please wait...