Tyler Technologies Inc. (TYL): Price and Financial Metrics
TYL Price/Volume Stats
Current price | $394.08 | 52-week high | $425.80 |
Prev. close | $398.22 | 52-week low | $281.11 |
Day low | $389.57 | Volume | 225,200 |
Day high | $398.18 | Avg. volume | 270,064 |
50-day MA | $376.38 | Dividend yield | N/A |
200-day MA | $344.38 | Market Cap | 16.52B |
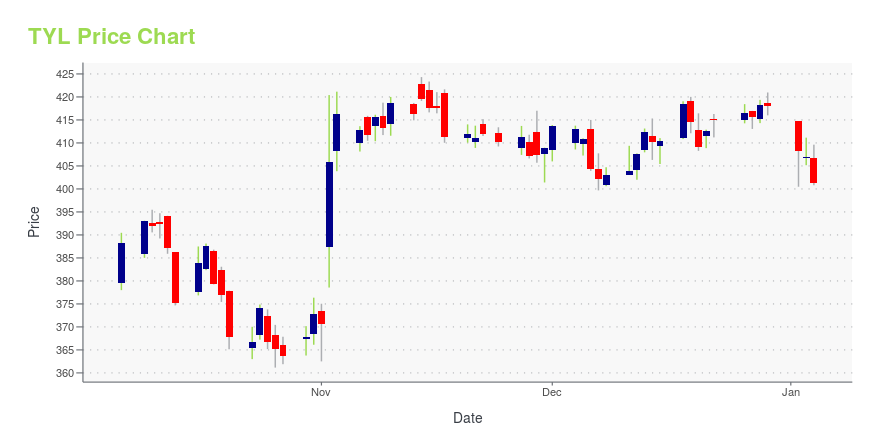
TYL Stock Price Chart Interactive Chart >
TYL POWR Grades
- Quality is the dimension where TYL ranks best; there it ranks ahead of 71.18% of US stocks.
- The strongest trend for TYL is in Growth, which has been heading up over the past 179 days.
- TYL ranks lowest in Value; there it ranks in the 6th percentile.
TYL Stock Summary
- TYL's one year PEG ratio, measuring expected growth in earnings next year relative to current common stock price is 1,044.36 -- higher than 97.78% of US-listed equities with positive expected earnings growth.
- TYLER TECHNOLOGIES INC's stock had its IPO on December 30, 1987, making it an older stock than 90.88% of US equities in our set.
- With a price/earnings ratio of 104.07, TYLER TECHNOLOGIES INC P/E ratio is greater than that of about 95.38% of stocks in our set with positive earnings.
- Stocks with similar financial metrics, market capitalization, and price volatility to TYLER TECHNOLOGIES INC are SPSC, PAYC, SSTI, CERT, and RGEN.
- Visit TYL's SEC page to see the company's official filings. To visit the company's web site, go to www.tylertech.com.
TYL Valuation Summary
- In comparison to the median Technology stock, TYL's EV/EBIT ratio is 301.42% higher, now standing at 84.9.
- TYL's price/sales ratio has moved up 7.5 over the prior 243 months.
Below are key valuation metrics over time for TYL.
Stock | Date | P/S | P/B | P/E | EV/EBIT |
---|---|---|---|---|---|
TYL | 2023-05-22 | 8.9 | 6.2 | 107.6 | 84.9 |
TYL | 2023-05-19 | 8.9 | 6.2 | 106.5 | 84.1 |
TYL | 2023-05-18 | 9.0 | 6.2 | 108.0 | 85.2 |
TYL | 2023-05-17 | 8.9 | 6.2 | 106.8 | 84.3 |
TYL | 2023-05-16 | 8.7 | 6.0 | 104.6 | 82.6 |
TYL | 2023-05-15 | 8.8 | 6.1 | 106.4 | 84.0 |
TYL Growth Metrics
- Its 4 year price growth rate is now at 98.08%.
- The 3 year revenue growth rate now stands at 82.44%.
- Its 2 year cash and equivalents growth rate is now at -19.45%.

The table below shows TYL's growth in key financial areas (numbers in millions of US dollars).
Date | Revenue | Operating Cash Flow | Net Income to Common Stock |
---|---|---|---|
2022-12-31 | 1,850.204 | 381.455 | 164.24 |
2022-09-30 | 1,831.521 | 374.608 | 187.945 |
2022-06-30 | 1,818.203 | 450.617 | 178.882 |
2022-03-31 | 1,753.593 | 353.591 | 164.466 |
2021-12-31 | 1,592.287 | 371.753 | 161.458 |
2021-09-30 | 1,442.035 | 345.504 | 160.77 |
TYL's Quality Factors
The “Quality” component of the POWR Ratings focuses on 31 different factors of a companies fundamentals and operational strength. Here are some key insights as we drill into the specifics of these quality attributes.- TYL has a Quality Grade of C, ranking ahead of 60.25% of graded US stocks.
- TYL's asset turnover comes in at 0.38 -- ranking 388th of 563 Business Services stocks.
- CARS, INUV, and VVI are the stocks whose asset turnover ratios are most correlated with TYL.
The table below shows TYL's key quality metrics over time.
Period | Asset Turnover | Gross Margin | ROIC |
---|---|---|---|
2021-09-30 | 0.380 | 0.458 | 0.144 |
2021-06-30 | 0.391 | 0.480 | 0.195 |
2021-03-31 | 0.424 | 0.491 | 0.391 |
2020-12-31 | 0.460 | 0.486 | 0.575 |
2020-09-30 | 0.483 | 0.487 | 0.591 |
2020-06-30 | 0.503 | 0.480 | 0.578 |
TYL Price Target
For more insight on analysts targets of TYL, see our TYL price target page. And for a list of of all stocks sorted by upside potential based on analyst target price, see our Top Price Target page.
Average Price Target | $533.77 | Average Broker Recommendation | 1.42 (Moderate Buy) |
Tyler Technologies Inc. (TYL) Company Bio
Tyler Technologies, Inc., based in Plano, Texas, is a provider of software to the United States public sector. Tyler Technologies has offices in 17 states and one in Toronto, Ontario, Canada. (Source:Wikipedia)
Latest TYL News From Around the Web
Below are the latest news stories about TYLER TECHNOLOGIES INC that investors may wish to consider to help them evaluate TYL as an investment opportunity.
City of Austin, Texas, Launches Open Data Portal with Tyler TechnologiesPLANO, Texas, June 06, 2023--Tyler Technologies announced the city of Austin, Texas, successfully launched a comprehensive Enterprise Data Platform to enhance data accessibility. |
Zacks Industry Outlook Highlights MSCI (MSCI), Tyler Technologies, Guidewire Software and ePlusMSCI (MSCI), Tyler Technologies, Guidewire Software and ePlus have been highlighted in this Industry Outlook article. |
4 Business-Software Services Stocks to Watch in a Thriving IndustryThe Zacks Business-Software Services industry players like MSCI, TYL, GWRE and PLUS are poised to continue benefiting from the increasing demand for multi-cloud-enabled software solutions amid the accelerated digital transformation and a shift to cloud initiatives. |
Tyler Technologies (TYL) Up 0.3% Since Last Earnings Report: Can It Continue?Tyler Technologies (TYL) reported earnings 30 days ago. What's next for the stock? We take a look at earnings estimates for some clues. |
Tyler Technologies (NYSE:TYL) shareholders have earned a 12% CAGR over the last five yearsWhen we invest, we're generally looking for stocks that outperform the market average. And in our experience, buying... |
TYL Price Returns
1-mo | 1.76% |
3-mo | 23.79% |
6-mo | 21.98% |
1-year | 8.39% |
3-year | 9.95% |
5-year | 70.08% |
YTD | 22.23% |
2022 | -40.07% |
2021 | 23.24% |
2020 | 45.50% |
2019 | 61.46% |
2018 | 4.95% |
Continue Researching TYL
Want to do more research on Tyler Technologies Inc's stock and its price? Try the links below:Tyler Technologies Inc (TYL) Stock Price | Nasdaq
Tyler Technologies Inc (TYL) Stock Quote, History and News - Yahoo Finance
Tyler Technologies Inc (TYL) Stock Price and Basic Information | MarketWatch
Loading social stream, please wait...