Travelzoo (TZOO): Price and Financial Metrics
TZOO Price/Volume Stats
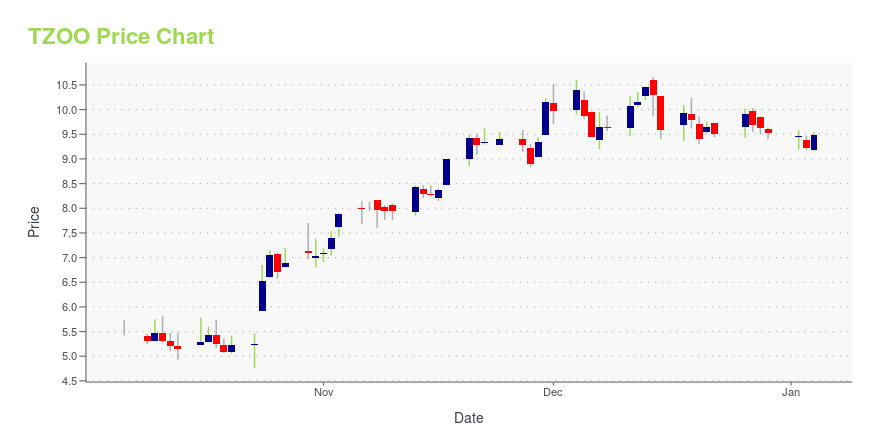
Current price | $10.18 | 52-week high | $11.23 |
Prev. close | $10.60 | 52-week low | $4.77 |
Day low | $10.10 | Volume | 81,000 |
Day high | $10.79 | Avg. volume | 108,572 |
50-day MA | $9.23 | Dividend yield | N/A |
200-day MA | $8.17 | Market Cap | 134.62M |
TZOO Stock Price Chart Interactive Chart >
TZOO POWR Grades
- TZOO scores best on the Quality dimension, with a Quality rank ahead of 99.55% of US stocks.
- TZOO's strongest trending metric is Growth; it's been moving down over the last 26 weeks.
- TZOO ranks lowest in Stability; there it ranks in the 18th percentile.
TZOO Stock Summary
- The capital turnover (annual revenue relative to shareholder's equity) for TZOO is 40.48 -- better than 99.48% of US stocks.
- Equity multiplier, or assets relative to shareholders' equity, comes in at 21.18 for TRAVELZOO; that's greater than it is for 97.99% of US stocks.
- Over the past twelve months, TZOO has reported earnings growth of 463.1%, putting it ahead of 97.47% of US stocks in our set.
- If you're looking for stocks that are quantitatively similar to TRAVELZOO, a group of peers worth examining would be ACI, VSCO, SNEX, AIRT, and HBI.
- Visit TZOO's SEC page to see the company's official filings. To visit the company's web site, go to www.travelzoo.com.
TZOO Valuation Summary
- In comparison to the median Communication Services stock, TZOO's price/sales ratio is 14.29% higher, now standing at 1.6.
- Over the past 243 months, TZOO's price/sales ratio has gone down 8.1.
Below are key valuation metrics over time for TZOO.
Stock | Date | P/S | P/B | P/E | EV/EBIT |
---|---|---|---|---|---|
TZOO | 2023-12-29 | 1.6 | 65.8 | 12.0 | 8.1 |
TZOO | 2023-12-28 | 1.6 | 66.5 | 12.1 | 8.2 |
TZOO | 2023-12-27 | 1.7 | 66.9 | 12.2 | 8.2 |
TZOO | 2023-12-26 | 1.7 | 68.4 | 12.5 | 8.4 |
TZOO | 2023-12-22 | 1.6 | 65.7 | 12.0 | 8.1 |
TZOO | 2023-12-21 | 1.6 | 66.6 | 12.1 | 8.2 |
TZOO Growth Metrics
- Its 5 year cash and equivalents growth rate is now at -55.59%.
- Its 4 year cash and equivalents growth rate is now at -55.59%.
- Its 2 year revenue growth rate is now at -33.72%.
The table below shows TZOO's growth in key financial areas (numbers in millions of US dollars).
Date | Revenue | Operating Cash Flow | Net Income to Common Stock |
---|---|---|---|
2022-09-30 | 65.652 | -38.215 | 0.898 |
2022-06-30 | 65.491 | -47.023 | 2.926 |
2022-03-31 | 66.881 | -23.911 | 4.912 |
2021-12-31 | 62.712 | -8.083 | 0.911 |
2021-09-30 | 61.534 | 18.718 | 4.922 |
2021-06-30 | 59.633 | 55.546 | 0.748 |
TZOO's Quality Factors
The “Quality” component of the POWR Ratings focuses on 31 different factors of a companies fundamentals and operational strength. Here are some key insights as we drill into the specifics of these quality attributes.- TZOO has a Quality Grade of A, ranking ahead of 99.91% of graded US stocks.
- TZOO's asset turnover comes in at 0.548 -- ranking 296th of 561 Business Services stocks.
- ARC, KELYA, and MANH are the stocks whose asset turnover ratios are most correlated with TZOO.
The table below shows TZOO's key quality metrics over time.
Period | Asset Turnover | Gross Margin | ROIC |
---|---|---|---|
2021-06-30 | 0.548 | 0.811 | -0.045 |
2021-03-31 | 0.505 | 0.771 | 0.316 |
2020-12-31 | 0.665 | 0.803 | 1.312 |
2020-09-30 | 0.991 | 0.839 | -10.201 |
2020-06-30 | 1.348 | 0.862 | -0.812 |
2020-03-31 | 1.795 | 0.885 | -0.137 |
TZOO Price Target
For more insight on analysts targets of TZOO, see our TZOO price target page. And for a list of of all stocks sorted by upside potential based on analyst target price, see our Top Price Target page.
Average Price Target | $23.67 | Average Broker Recommendation | 1.33 (Strong Buy) |
Travelzoo (TZOO) Company Bio
Travelzoo publishes travel, entertainment, and local deals from travel and entertainment companies, and local businesses in North America, Europe, and the Asia Pacific. The company was founded in 1998 and is based in New York, New York.
Latest TZOO News From Around the Web
Below are the latest news stories about TRAVELZOO that investors may wish to consider to help them evaluate TZOO as an investment opportunity.
Is Expedia Group (EXPE) Stock Undervalued Right Now?Here at Zacks, our focus is on the proven Zacks Rank system, which emphasizes earnings estimates and estimate revisions to find great stocks. Nevertheless, we are always paying attention to the latest value, growth, and momentum trends to underscore strong picks. |
3 Dirt-Cheap Stocks Primed for Massive GrowthThese three overlooked cheap stocks are trading at inexpensive valuations compared to their earnings potential over the next several years. |
Travelzoo Introduces Membership Fee for New Members Beginning January 1, 2024Travelzoo (NASDAQ: TZOO), a global Internet media company, today announced that the Travelzoo® membership will not be a free service any longer. Beginning January 1, 2024, the annual membership fee will be $40 (fees in other currencies will be approximately the same). |
New Strong Buy Stocks for December 13thTZOO, GLPG, BBVA, TW and STNE have been added to the Zacks Rank #1 (Strong Buy) List on December 13, 2023. |
Best Value Stocks to Buy for December 13thTZOO, VSTA and STNE made it to the Zacks Rank #1 (Strong Buy) value stocks list on December 13, 2023. |
TZOO Price Returns
1-mo | 14.13% |
3-mo | 6.82% |
6-mo | 74.61% |
1-year | 84.42% |
3-year | -34.36% |
5-year | -24.03% |
YTD | 6.82% |
2023 | 114.16% |
2022 | -52.76% |
2021 | -0.21% |
2020 | -11.78% |
2019 | 8.85% |
Continue Researching TZOO
Want to see what other sources are saying about Travelzoo's financials and stock price? Try the links below:Travelzoo (TZOO) Stock Price | Nasdaq
Travelzoo (TZOO) Stock Quote, History and News - Yahoo Finance
Travelzoo (TZOO) Stock Price and Basic Information | MarketWatch
Loading social stream, please wait...