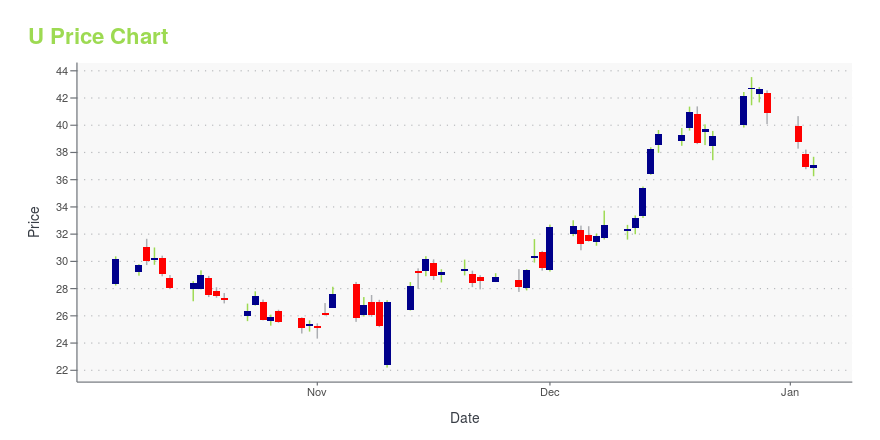
Unity Software Inc. (U): Price and Financial Metrics
U Price/Volume Stats
| Current price | $16.61 | 52-week high | $47.16 |
| Prev. close | $16.18 | 52-week low | $15.15 |
| Day low | $16.24 | Volume | 7,308,838 |
| Day high | $16.78 | Avg. volume | 9,561,234 |
| 50-day MA | $17.49 | Dividend yield | N/A |
| 200-day MA | $26.70 | Market Cap | 6.49B |
U Stock Price Chart Interactive Chart >
Unity Software Inc. (U) Company Bio
Unity Software Inc. (doing business as Unity Technologies) is a video game software development company based in San Francisco. It was founded in Denmark in 2004 as Over the Edge Entertainment (OTEE) and changed its name in 2007. Unity Technologies is best known for the development of Unity, a licensed game engine used to create video games and other applications. As of 2020, Unity Technologies has undergone significant growth despite reporting financial losses for every year since its founding in 2004. (Source:Wikipedia)
Latest U News From Around the Web
Below are the latest news stories about UNITY SOFTWARE INC that investors may wish to consider to help them evaluate U as an investment opportunity.
Web3 Winners: 3 Stocks to Invest in the Decentralized WebWeb3 stocks are set to be a massive digital sector in coming years despite recent downturns and turbulence. |
3 Metaverse Stocks to Buy Right NowThese three stocks could be poised to win big as the metaverse scales. |
Unity Software Inc's SVP, Chief Legal Officer Anirma Gupta Sells 2,551 SharesOn December 26, 2023, Anirma Gupta, the SVP, Chief Legal Officer of Unity Software Inc (NYSE:U), sold 2,551 shares of the company. |
Why These 3 Metaverse Stocks Should Be on Your Radar in 2024Artificial intelligence will facilitate the buildout of the metaverse, which is why you should consider metaverse stocks for your portfolio. |
3 Metaverse Stocks You’ll Regret Not Buying Soon: December EditionMetaverse stocks are hot-button topics in the media, and these are three companies you can't afford to overlook. |
U Price Returns
| 1-mo | 0.91% |
| 3-mo | -31.16% |
| 6-mo | -49.83% |
| 1-year | -61.56% |
| 3-year | -83.52% |
| 5-year | N/A |
| YTD | -59.38% |
| 2023 | 43.02% |
| 2022 | -80.01% |
| 2021 | -6.83% |
| 2020 | N/A |
| 2019 | N/A |


Loading social stream, please wait...