
Under Armour Inc. Cl C (UA): Price and Financial Metrics
UA Price/Volume Stats
| Current price | $6.71 | 52-week high | $8.99 |
| Prev. close | $6.59 | 52-week low | $5.86 |
| Day low | $6.58 | Volume | 1,896,119 |
| Day high | $6.72 | Avg. volume | 3,153,515 |
| 50-day MA | $6.64 | Dividend yield | N/A |
| 200-day MA | $7.13 | Market Cap | 2.93B |
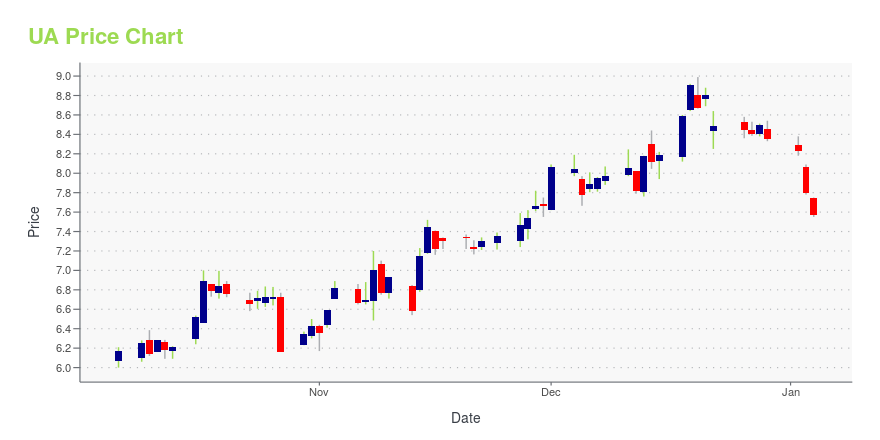
UA Stock Price Chart Interactive Chart >
Under Armour Inc. Cl C (UA) Company Bio
Under Armour, Inc. is an American sports equipment company that manufactures footwear, sports and casual apparel. Under Armour's global headquarters are located in Baltimore, Maryland, with additional offices located in Amsterdam (European headquarters), Austin, Guangzhou, Hong Kong, Houston, Jakarta, London, Mexico City, Munich, New York City, Panama City (international headquarters), Paris, Pittsburgh, Portland, San Francisco, São Paulo, Santiago, Seoul, Shanghai (Greater Chinese headquarters), and Toronto. (Source:Wikipedia)
UA Price Returns
| 1-mo | -1.47% |
| 3-mo | 2.44% |
| 6-mo | -10.05% |
| 1-year | -7.19% |
| 3-year | -61.79% |
| 5-year | -72.24% |
| YTD | -19.64% |
| 2023 | -6.39% |
| 2022 | -50.55% |
| 2021 | 21.24% |
| 2020 | -22.42% |
| 2019 | 18.61% |
Loading social stream, please wait...