
United Airlines Holdings, Inc. (UAL): Price and Financial Metrics
UAL Price/Volume Stats
| Current price | $47.37 | 52-week high | $56.17 |
| Prev. close | $46.72 | 52-week low | $33.68 |
| Day low | $46.39 | Volume | 5,867,000 |
| Day high | $47.49 | Avg. volume | 8,991,781 |
| 50-day MA | $49.83 | Dividend yield | N/A |
| 200-day MA | $44.54 | Market Cap | 15.58B |
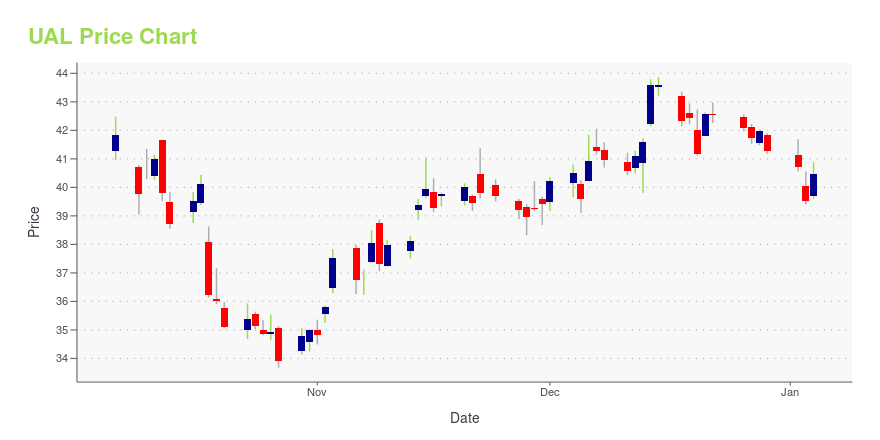
UAL Stock Price Chart Interactive Chart >
United Airlines Holdings, Inc. (UAL) Company Bio
United Continental Holdings provides air transportation services in North America, the Asia-Pacific, Europe, the Middle East, Africa, and Latin America. The company was founded in 1934 and is based in Chicago, Illinois.
Latest UAL News From Around the Web
Below are the latest news stories about UNITED AIRLINES HOLDINGS INC that investors may wish to consider to help them evaluate UAL as an investment opportunity.
UPDATE 4-Boeing urges 737 MAX inspections for possible loose boltAirplane maker Boeing is urging airlines to inspect 737 MAX airplanes for a possible loose bolt in the rudder control system, the Federal Aviation Administration (FAA) said on Thursday. The FAA said it was closely monitoring Boeing 737 MAX targeted inspections and will consider additional action based on any further discovery of loose or missing hardware. Boeing recommended inspections after an international operator discovered a bolt with a missing nut while performing routine maintenance on a mechanism in the rudder-control linkage, the FAA said. |
10 Most Dangerous Airlines In The WorldIn this article, we will take a look at the 10 most dangerous airlines in the world. If you want to skip our discussion on the airline industry, you can go directly to the 5 Most Dangerous Airlines In The World. Air transport is essential for the development of the global economy as it facilitates […] |
Citi names GM, Delta, KeyCorp as top stocks for 2024Citigroup (C) has unveiled its top stock picks for 2024. Despite macroeconomic uncertainty, Citi analysts have named Delta (DAL), United (UAL), Boeing (BA) in aviation, General Motors (GM) for autos, and regional lender KeyCorp (KEY) among stocks it expects to outperform in the new year. Yahoo Finance's Brian Sozzi and Brad Smith analyze Citi's forecasts, providing insights into how the stocks have been performing throughout 2023. For more expert insight and the latest market action, click here to watch this full episode of Yahoo Finance Live. |
United Airlines insists on one rule many passengers don't likeAirline passengers working their way through the traveling process are often looking to make the sometimes difficult experience as enjoyable as possible. First, on a larger scale, it's important to note that United is a founding member of Star Alliance, a global aviation partnership. Star Alliance currently has 26 member airlines. |
High-Tech Transportation: 7 Future Mobility Stocks to Ride Your Capital HigherThese future mobility stocks are sitting at the vanguard of the transportation sector and offer exposure to strong returns. |
UAL Price Returns
| 1-mo | -1.46% |
| 3-mo | -10.35% |
| 6-mo | 11.33% |
| 1-year | -11.06% |
| 3-year | -2.63% |
| 5-year | -49.26% |
| YTD | 14.81% |
| 2023 | 9.44% |
| 2022 | -13.89% |
| 2021 | 1.23% |
| 2020 | -50.90% |
| 2019 | 5.21% |
Continue Researching UAL
Want to do more research on United Airlines Holdings Inc's stock and its price? Try the links below:United Airlines Holdings Inc (UAL) Stock Price | Nasdaq
United Airlines Holdings Inc (UAL) Stock Quote, History and News - Yahoo Finance
United Airlines Holdings Inc (UAL) Stock Price and Basic Information | MarketWatch
Loading social stream, please wait...