
Ultra Clean Holdings, Inc. (UCTT): Price and Financial Metrics
UCTT Price/Volume Stats
| Current price | $45.81 | 52-week high | $56.47 |
| Prev. close | $45.13 | 52-week low | $22.15 |
| Day low | $45.52 | Volume | 862,790 |
| Day high | $54.00 | Avg. volume | 317,413 |
| 50-day MA | $48.34 | Dividend yield | N/A |
| 200-day MA | $39.25 | Market Cap | 2.05B |
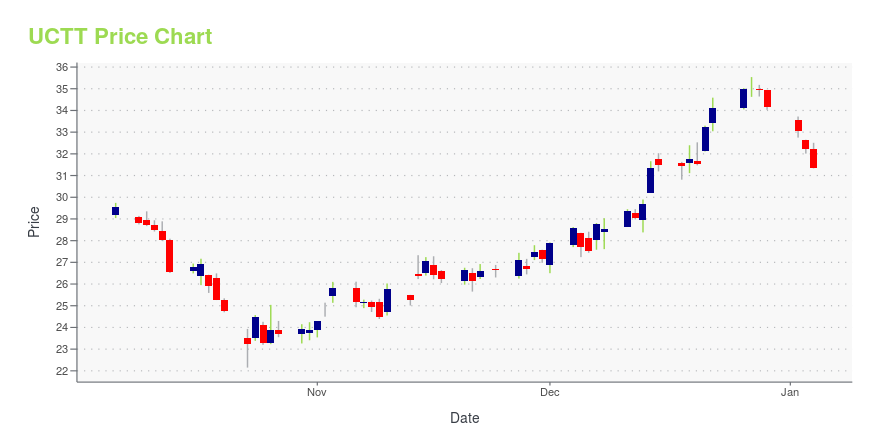
UCTT Stock Price Chart Interactive Chart >
Ultra Clean Holdings, Inc. (UCTT) Company Bio
Ultra Clean Holdings designs, develops, prototypes, engineers, manufactures, and tests subsystems tailored to specific steps in the semiconductor manufacturing process and manufacturing processes in other addressed industries primarily in North America, Asia, and Europe. The company was founded in 1991 and is based in Hayward, California.
Latest UCTT News From Around the Web
Below are the latest news stories about ULTRA CLEAN HOLDINGS INC that investors may wish to consider to help them evaluate UCTT as an investment opportunity.
Insider Sell Alert: CIO Jeffrey Mckibben Sells Shares of Ultra Clean Holdings Inc (UCTT)In the realm of stock market movements, insider trading activity is often a significant indicator that investors keep a close eye on. |
Ultra Clean Announces Departure of Chief Operating OfficerUltra Clean Holdings, Inc. (Nasdaq: UCTT), today announced that Vijay Chinnasami, Chief Operating Officer, will be leaving UCT as of December 31, 2023. |
Ultra Clean Holdings, Inc. (NASDAQ:UCTT) Q3 2023 Earnings Call TranscriptUltra Clean Holdings, Inc. (NASDAQ:UCTT) Q3 2023 Earnings Call Transcript October 25, 2023 Ultra Clean Holdings, Inc. misses on earnings expectations. Reported EPS is $0.04 EPS, expectations were $0.15. Operator: Good day, and welcome to the Ultra Clean Q3 2023 Earnings Call and Webcast. All participants will be in listen-only mode. [Operator instructions] Please note, […] |
Q3 2023 Ultra Clean Holdings Inc Earnings CallQ3 2023 Ultra Clean Holdings Inc Earnings Call |
UCT Acquires HIS Innovations GroupUltra Clean Holdings, Inc. (Nasdaq: UCTT), today announced that it has closed the acquisition of HIS Innovations Group, a privately held company based in Hillsboro, Oregon. HIS is a leading supplier to the semiconductor sub-fab segment including the design, manufacturing, and integration of components, process solutions, and fully integrated sub-systems. |
UCTT Price Returns
| 1-mo | -2.68% |
| 3-mo | 9.18% |
| 6-mo | 21.45% |
| 1-year | 26.72% |
| 3-year | -8.03% |
| 5-year | 201.98% |
| YTD | 34.18% |
| 2023 | 2.99% |
| 2022 | -42.21% |
| 2021 | 84.14% |
| 2020 | 32.72% |
| 2019 | 177.10% |
Continue Researching UCTT
Here are a few links from around the web to help you further your research on Ultra Clean Holdings Inc's stock as an investment opportunity:Ultra Clean Holdings Inc (UCTT) Stock Price | Nasdaq
Ultra Clean Holdings Inc (UCTT) Stock Quote, History and News - Yahoo Finance
Ultra Clean Holdings Inc (UCTT) Stock Price and Basic Information | MarketWatch
Loading social stream, please wait...